Streptomyces seoulensis
Taxonomy:
Average proteome isoelectric point is 6.43
Get precalculated fractions of proteins
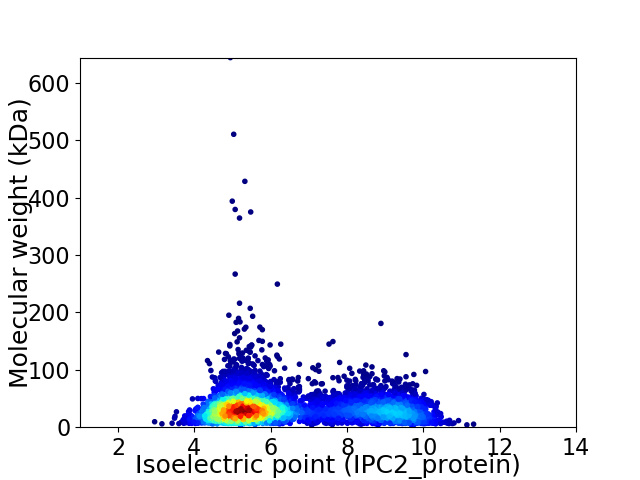
Virtual 2D-PAGE plot for 5663 proteins (isoelectric point calculated using IPC2_protein)
Get csv file with sequences according to given criteria:
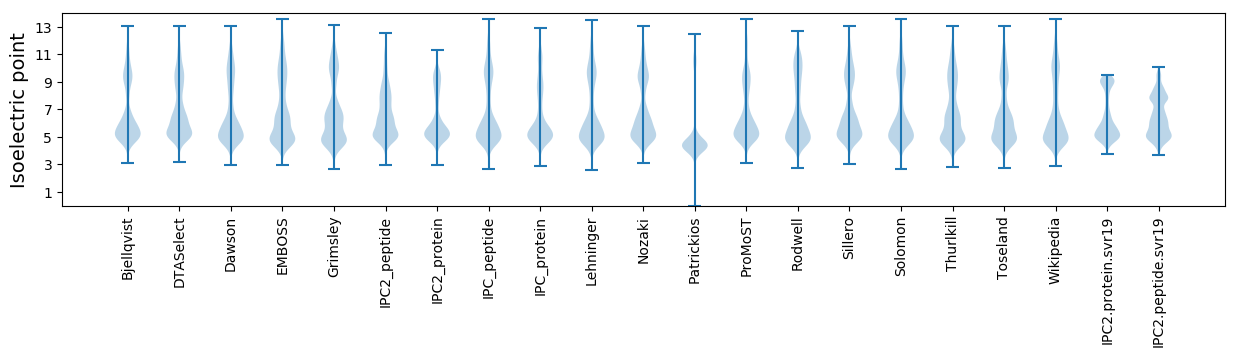
* You can choose from 21 different methods for calculating isoelectric point
Summary statistics related to proteome-wise predictions
Protein with the lowest isoelectric point:
>tr|A0A4P6U0T6|A0A4P6U0T6_STRSO ABC transporter permease OS=Streptomyces seoulensis OX=73044 GN=D0Z67_22455 PE=4 SV=1
MM1 pKa = 7.03HH2 pKa = 7.49TDD4 pKa = 3.05IEE6 pKa = 4.32IDD8 pKa = 3.29KK9 pKa = 9.91DD10 pKa = 3.69LCIGAGQCTLAAPSVFTQDD29 pKa = 3.05DD30 pKa = 3.79DD31 pKa = 5.02GYY33 pKa = 9.86STVLPGAEE41 pKa = 4.64DD42 pKa = 4.08GAGSPMLRR50 pKa = 11.84EE51 pKa = 4.14AARR54 pKa = 11.84ACPVGAITVTEE65 pKa = 4.27SS66 pKa = 2.71
MM1 pKa = 7.03HH2 pKa = 7.49TDD4 pKa = 3.05IEE6 pKa = 4.32IDD8 pKa = 3.29KK9 pKa = 9.91DD10 pKa = 3.69LCIGAGQCTLAAPSVFTQDD29 pKa = 3.05DD30 pKa = 3.79DD31 pKa = 5.02GYY33 pKa = 9.86STVLPGAEE41 pKa = 4.64DD42 pKa = 4.08GAGSPMLRR50 pKa = 11.84EE51 pKa = 4.14AARR54 pKa = 11.84ACPVGAITVTEE65 pKa = 4.27SS66 pKa = 2.71
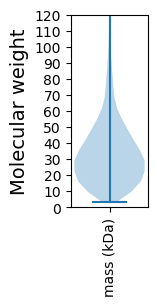
Molecular weight: 6.74 kDa
Isoelectric point according different methods:
Protein with the highest isoelectric point:
>tr|A0A4V0ZZR2|A0A4V0ZZR2_STRSO Metallophosphoesterase OS=Streptomyces seoulensis OX=73044 GN=D0Z67_17910 PE=4 SV=1
MM1 pKa = 7.69SKK3 pKa = 9.0RR4 pKa = 11.84TFQPNNRR11 pKa = 11.84RR12 pKa = 11.84RR13 pKa = 11.84AKK15 pKa = 8.7THH17 pKa = 5.15GFRR20 pKa = 11.84LRR22 pKa = 11.84MRR24 pKa = 11.84TRR26 pKa = 11.84AGRR29 pKa = 11.84AILATRR35 pKa = 11.84RR36 pKa = 11.84SKK38 pKa = 10.88GRR40 pKa = 11.84ARR42 pKa = 11.84LSAA45 pKa = 3.91
MM1 pKa = 7.69SKK3 pKa = 9.0RR4 pKa = 11.84TFQPNNRR11 pKa = 11.84RR12 pKa = 11.84RR13 pKa = 11.84AKK15 pKa = 8.7THH17 pKa = 5.15GFRR20 pKa = 11.84LRR22 pKa = 11.84MRR24 pKa = 11.84TRR26 pKa = 11.84AGRR29 pKa = 11.84AILATRR35 pKa = 11.84RR36 pKa = 11.84SKK38 pKa = 10.88GRR40 pKa = 11.84ARR42 pKa = 11.84LSAA45 pKa = 3.91
Molecular weight: 5.3 kDa
Isoelectric point according different methods:
Peptides (in silico digests for buttom-up proteomics)
Below you can find in silico digests of the whole proteome with Trypsin, Chymotrypsin, Trypsin+LysC, LysN, ArgC proteases suitable for different mass spec machines.| Try ESI |
 |
|---|
| ChTry ESI |
|
|---|
| ArgC ESI |
|
|---|
| LysN ESI |
|
|---|
| TryLysC ESI |
|
|---|
| Try MALDI |
|
|---|
| ChTry MALDI |
|
|---|
| ArgC MALDI |
|
|---|
| LysN MALDI |
|
|---|
| TryLysC MALDI |
|
|---|
| Try LTQ |
|
|---|
| ChTry LTQ |
|
|---|
| ArgC LTQ |
|
|---|
| LysN LTQ |
|
|---|
| TryLysC LTQ |
|
|---|
| Try MSlow |
|
|---|
| ChTry MSlow |
|
|---|
| ArgC MSlow |
|
|---|
| LysN MSlow |
|
|---|
| TryLysC MSlow |
|
|---|
| Try MShigh |
|
|---|
| ChTry MShigh |
|
|---|
| ArgC MShigh |
|
|---|
| LysN MShigh |
|
|---|
| TryLysC MShigh |
|
|---|
General Statistics
Number of major isoforms |
Number of additional isoforms |
Number of all proteins |
Number of amino acids |
Min. Seq. Length |
Max. Seq. Length |
Avg. Seq. Length |
Avg. Mol. Weight |
|---|---|---|---|---|---|---|---|
0 |
1872533 |
29 |
6199 |
330.7 |
35.41 |
Amino acid frequency
Ala |
Cys |
Asp |
Glu |
Phe |
Gly |
His |
Ile |
Lys |
Leu |
|---|---|---|---|---|---|---|---|---|---|
13.543 ± 0.046 | 0.768 ± 0.008 |
6.0 ± 0.024 | 5.748 ± 0.04 |
2.714 ± 0.02 | 9.497 ± 0.032 |
2.315 ± 0.016 | 3.028 ± 0.023 |
2.247 ± 0.026 | 10.438 ± 0.043 |
Met |
Asn |
Gln |
Pro |
Arg |
Ser |
Thr |
Val |
Trp |
Tyr |
|---|---|---|---|---|---|---|---|---|---|
1.719 ± 0.015 | 1.749 ± 0.019 |
6.167 ± 0.033 | 2.698 ± 0.02 |
8.065 ± 0.038 | 4.978 ± 0.025 |
6.208 ± 0.032 | 8.503 ± 0.031 |
1.489 ± 0.015 | 2.124 ± 0.019 |
Most of the basic statistics you can see at this page can be downloaded from this CSV file
See this proteome in:

Proteome-pI is available under Creative Commons Attribution-NoDerivs license, for more details see here
| Reference: Kozlowski LP. Proteome-pI 2.0: Proteome Isoelectric Point Database Update. Nucleic Acids Res. 2021, doi: 10.1093/nar/gkab944 | Contact: Lukasz P. Kozlowski |