Synechococcus phage S-LBS1
Taxonomy: Viruses; Duplodnaviria; Heunggongvirae; Uroviricota; Caudoviricetes; Caudovirales; Siphoviridae; unclassified Siphoviridae
Average proteome isoelectric point is 6.21
Get precalculated fractions of proteins

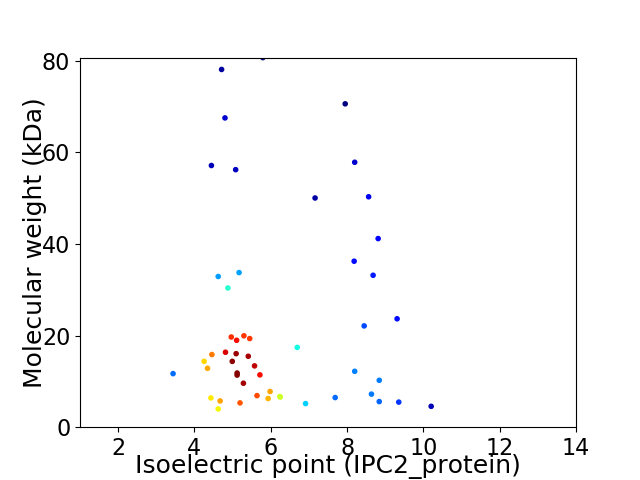
Virtual 2D-PAGE plot for 52 proteins (isoelectric point calculated using IPC2_protein)
Get csv file with sequences according to given criteria:
* You can choose from 21 different methods for calculating isoelectric point
Summary statistics related to proteome-wise predictions


Protein with the lowest isoelectric point:
>tr|A0A2I5ARA3|A0A2I5ARA3_9CAUD Uncharacterized protein OS=Synechococcus phage S-LBS1 OX=2008320 GN=SLBS1_A07 PE=4 SV=1
MM1 pKa = 7.78AFTEE5 pKa = 4.07NLDD8 pKa = 3.34VFLADD13 pKa = 4.39FGVSVTAGAVSGLGLLDD30 pKa = 3.54MPGEE34 pKa = 4.13LVADD38 pKa = 4.09GMVISTDD45 pKa = 3.31YY46 pKa = 10.84MLTAKK51 pKa = 10.59ADD53 pKa = 3.84DD54 pKa = 4.55FGSLLYY60 pKa = 10.78GDD62 pKa = 5.18SILVNSDD69 pKa = 3.95LYY71 pKa = 10.89SVRR74 pKa = 11.84QVLLIDD80 pKa = 4.47DD81 pKa = 4.08GRR83 pKa = 11.84MIQAGLQLVTAAAQAVYY100 pKa = 10.73VPDD103 pKa = 3.64VFQAGVYY110 pKa = 9.45LL111 pKa = 4.12
MM1 pKa = 7.78AFTEE5 pKa = 4.07NLDD8 pKa = 3.34VFLADD13 pKa = 4.39FGVSVTAGAVSGLGLLDD30 pKa = 3.54MPGEE34 pKa = 4.13LVADD38 pKa = 4.09GMVISTDD45 pKa = 3.31YY46 pKa = 10.84MLTAKK51 pKa = 10.59ADD53 pKa = 3.84DD54 pKa = 4.55FGSLLYY60 pKa = 10.78GDD62 pKa = 5.18SILVNSDD69 pKa = 3.95LYY71 pKa = 10.89SVRR74 pKa = 11.84QVLLIDD80 pKa = 4.47DD81 pKa = 4.08GRR83 pKa = 11.84MIQAGLQLVTAAAQAVYY100 pKa = 10.73VPDD103 pKa = 3.64VFQAGVYY110 pKa = 9.45LL111 pKa = 4.12
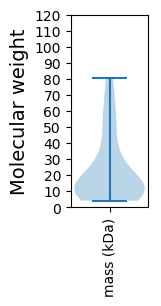
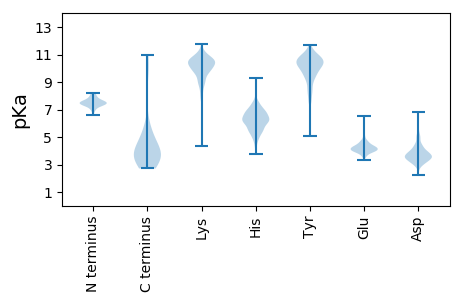
Molecular weight: 11.69 kDa
Isoelectric point according different methods:
Protein with the highest isoelectric point:
>tr|A0A2I5ARE3|A0A2I5ARE3_9CAUD Superfamily II DNA or RNA helicase OS=Synechococcus phage S-LBS1 OX=2008320 GN=SLBS1_A50 PE=4 SV=1
MM1 pKa = 6.6TTPPRR6 pKa = 11.84WTQPEE11 pKa = 4.48LDD13 pKa = 4.26HH14 pKa = 7.34LEE16 pKa = 4.25SLAGDD21 pKa = 3.8VPFPTLLRR29 pKa = 11.84SMHH32 pKa = 5.88YY33 pKa = 10.21KK34 pKa = 9.14ATAEE38 pKa = 4.0GWPPRR43 pKa = 11.84TDD45 pKa = 2.97KK46 pKa = 11.31AIVMRR51 pKa = 11.84MRR53 pKa = 11.84RR54 pKa = 11.84SRR56 pKa = 11.84QFCRR60 pKa = 11.84ARR62 pKa = 11.84TGEE65 pKa = 3.72WTTTYY70 pKa = 10.95GAGEE74 pKa = 4.01ILGCPGTRR82 pKa = 11.84VEE84 pKa = 3.51AWLRR88 pKa = 11.84RR89 pKa = 11.84KK90 pKa = 9.83PIARR94 pKa = 11.84ILDD97 pKa = 3.75PQTTGGTRR105 pKa = 11.84YY106 pKa = 9.57INRR109 pKa = 11.84RR110 pKa = 11.84SWRR113 pKa = 11.84RR114 pKa = 11.84LAKK117 pKa = 10.07QMPRR121 pKa = 11.84VLGGFSSDD129 pKa = 3.52ALFLLLEE136 pKa = 4.77DD137 pKa = 5.02RR138 pKa = 11.84DD139 pKa = 3.96LADD142 pKa = 6.35AIAQQHH148 pKa = 6.02PRR150 pKa = 11.84PIGDD154 pKa = 2.72WRR156 pKa = 11.84VRR158 pKa = 11.84CIEE161 pKa = 3.77TGEE164 pKa = 4.41IYY166 pKa = 10.64SSCGAAARR174 pKa = 11.84EE175 pKa = 3.96LHH177 pKa = 5.52VTQACISLAIRR188 pKa = 11.84QARR191 pKa = 11.84PVAALGMTFEE201 pKa = 4.74ALRR204 pKa = 11.84GVGPVLGG211 pKa = 4.21
MM1 pKa = 6.6TTPPRR6 pKa = 11.84WTQPEE11 pKa = 4.48LDD13 pKa = 4.26HH14 pKa = 7.34LEE16 pKa = 4.25SLAGDD21 pKa = 3.8VPFPTLLRR29 pKa = 11.84SMHH32 pKa = 5.88YY33 pKa = 10.21KK34 pKa = 9.14ATAEE38 pKa = 4.0GWPPRR43 pKa = 11.84TDD45 pKa = 2.97KK46 pKa = 11.31AIVMRR51 pKa = 11.84MRR53 pKa = 11.84RR54 pKa = 11.84SRR56 pKa = 11.84QFCRR60 pKa = 11.84ARR62 pKa = 11.84TGEE65 pKa = 3.72WTTTYY70 pKa = 10.95GAGEE74 pKa = 4.01ILGCPGTRR82 pKa = 11.84VEE84 pKa = 3.51AWLRR88 pKa = 11.84RR89 pKa = 11.84KK90 pKa = 9.83PIARR94 pKa = 11.84ILDD97 pKa = 3.75PQTTGGTRR105 pKa = 11.84YY106 pKa = 9.57INRR109 pKa = 11.84RR110 pKa = 11.84SWRR113 pKa = 11.84RR114 pKa = 11.84LAKK117 pKa = 10.07QMPRR121 pKa = 11.84VLGGFSSDD129 pKa = 3.52ALFLLLEE136 pKa = 4.77DD137 pKa = 5.02RR138 pKa = 11.84DD139 pKa = 3.96LADD142 pKa = 6.35AIAQQHH148 pKa = 6.02PRR150 pKa = 11.84PIGDD154 pKa = 2.72WRR156 pKa = 11.84VRR158 pKa = 11.84CIEE161 pKa = 3.77TGEE164 pKa = 4.41IYY166 pKa = 10.64SSCGAAARR174 pKa = 11.84EE175 pKa = 3.96LHH177 pKa = 5.52VTQACISLAIRR188 pKa = 11.84QARR191 pKa = 11.84PVAALGMTFEE201 pKa = 4.74ALRR204 pKa = 11.84GVGPVLGG211 pKa = 4.21
Molecular weight: 23.65 kDa
Isoelectric point according different methods:
Peptides (in silico digests for buttom-up proteomics)
Below you can find in silico digests of the whole proteome with Trypsin, Chymotrypsin, Trypsin+LysC, LysN, ArgC proteases suitable for different mass spec machines.| Try ESI |
 |
|---|
| ChTry ESI |
 |
|---|
| ArgC ESI |
 |
|---|
| LysN ESI |
 |
|---|
| TryLysC ESI |
 |
|---|
| Try MALDI |
 |
|---|
| ChTry MALDI |
 |
|---|
| ArgC MALDI |
 |
|---|
| LysN MALDI |
 |
|---|
| TryLysC MALDI |
 |
|---|
| Try LTQ |
 |
|---|
| ChTry LTQ |
 |
|---|
| ArgC LTQ |
 |
|---|
| LysN LTQ |
 |
|---|
| TryLysC LTQ |
 |
|---|
| Try MSlow |
 |
|---|
| ChTry MSlow |
 |
|---|
| ArgC MSlow |
 |
|---|
| LysN MSlow |
 |
|---|
| TryLysC MSlow |
 |
|---|
| Try MShigh |
 |
|---|
| ChTry MShigh |
 |
|---|
| ArgC MShigh |
 |
|---|
| LysN MShigh |
 |
|---|
| TryLysC MShigh |
 |
|---|
General Statistics
Number of major isoforms |
Number of additional isoforms |
Number of all proteins |
Number of amino acids |
Min. Seq. Length |
Max. Seq. Length |
Avg. Seq. Length |
Avg. Mol. Weight |
|---|---|---|---|---|---|---|---|
0 |
11114 |
37 |
740 |
213.7 |
23.15 |
Amino acid frequency
Ala |
Cys |
Asp |
Glu |
Phe |
Gly |
His |
Ile |
Lys |
Leu |
|---|---|---|---|---|---|---|---|---|---|
11.931 ± 0.49 | 1.242 ± 0.184 |
5.255 ± 0.248 | 5.543 ± 0.405 |
3.068 ± 0.208 | 8.251 ± 0.444 |
1.665 ± 0.186 | 5.192 ± 0.233 |
3.14 ± 0.247 | 8.827 ± 0.349 |
Met |
Asn |
Gln |
Pro |
Arg |
Ser |
Thr |
Val |
Trp |
Tyr |
|---|---|---|---|---|---|---|---|---|---|
2.123 ± 0.158 | 3.059 ± 0.268 |
5.102 ± 0.242 | 4.634 ± 0.255 |
6.478 ± 0.487 | 6.676 ± 0.403 |
7.018 ± 0.509 | 6.793 ± 0.239 |
1.728 ± 0.18 | 2.276 ± 0.173 |
Most of the basic statistics you can see at this page can be downloaded from this CSV file
Proteome-pI is available under Creative Commons Attribution-NoDerivs license, for more details see here
| Reference: Kozlowski LP. Proteome-pI 2.0: Proteome Isoelectric Point Database Update. Nucleic Acids Res. 2021, doi: 10.1093/nar/gkab944 | Contact: Lukasz P. Kozlowski |
