Mycoplasma synoviae (strain 53)
Taxonomy: cellular organisms; Bacteria; Terrabacteria group; Tenericutes; Mollicutes; Mycoplasmatales; Mycoplasmataceae; Mycoplasmopsis; Mycoplasmopsis synoviae
Average proteome isoelectric point is 7.5
Get precalculated fractions of proteins

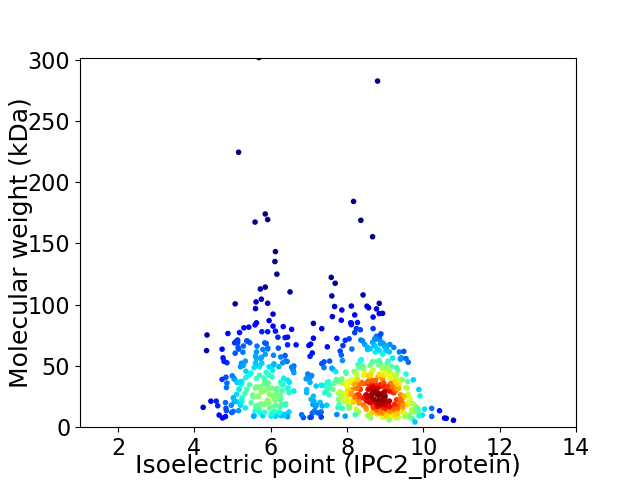
Virtual 2D-PAGE plot for 679 proteins (isoelectric point calculated using IPC2_protein)
Get csv file with sequences according to given criteria:
* You can choose from 21 different methods for calculating isoelectric point
Summary statistics related to proteome-wise predictions


Protein with the lowest isoelectric point:
>tr|Q4A6D1|Q4A6D1_MYCS5 Excinuclease ABC subunit C OS=Mycoplasma synoviae (strain 53) OX=262723 GN=uvrC PE=4 SV=1
MM1 pKa = 7.85SDD3 pKa = 2.69TADD6 pKa = 3.27IVNEE10 pKa = 4.1LDD12 pKa = 3.58LPGDD16 pKa = 3.73FEE18 pKa = 4.49IVKK21 pKa = 10.51LGALALEE28 pKa = 4.49STNLVLTVLSKK39 pKa = 10.64IQIDD43 pKa = 3.59GTYY46 pKa = 9.56IYY48 pKa = 9.83TYY50 pKa = 10.76VSAINYY56 pKa = 7.36EE57 pKa = 4.35LNKK60 pKa = 9.96QDD62 pKa = 5.83DD63 pKa = 4.27MVLLSRR69 pKa = 11.84LFSQLKK75 pKa = 9.55QDD77 pKa = 4.71ADD79 pKa = 3.74NLSWWRR85 pKa = 11.84KK86 pKa = 7.75YY87 pKa = 11.23LLGGWIISEE96 pKa = 4.35KK97 pKa = 10.91ANEE100 pKa = 4.13LAQKK104 pKa = 6.97TTDD107 pKa = 3.53YY108 pKa = 10.59YY109 pKa = 11.26QEE111 pKa = 5.35AINKK115 pKa = 8.36YY116 pKa = 9.11NNSIQAQQQYY126 pKa = 11.06SDD128 pKa = 4.44YY129 pKa = 10.66EE130 pKa = 3.99NQIYY134 pKa = 10.09QSYY137 pKa = 10.86NSYY140 pKa = 11.31
MM1 pKa = 7.85SDD3 pKa = 2.69TADD6 pKa = 3.27IVNEE10 pKa = 4.1LDD12 pKa = 3.58LPGDD16 pKa = 3.73FEE18 pKa = 4.49IVKK21 pKa = 10.51LGALALEE28 pKa = 4.49STNLVLTVLSKK39 pKa = 10.64IQIDD43 pKa = 3.59GTYY46 pKa = 9.56IYY48 pKa = 9.83TYY50 pKa = 10.76VSAINYY56 pKa = 7.36EE57 pKa = 4.35LNKK60 pKa = 9.96QDD62 pKa = 5.83DD63 pKa = 4.27MVLLSRR69 pKa = 11.84LFSQLKK75 pKa = 9.55QDD77 pKa = 4.71ADD79 pKa = 3.74NLSWWRR85 pKa = 11.84KK86 pKa = 7.75YY87 pKa = 11.23LLGGWIISEE96 pKa = 4.35KK97 pKa = 10.91ANEE100 pKa = 4.13LAQKK104 pKa = 6.97TTDD107 pKa = 3.53YY108 pKa = 10.59YY109 pKa = 11.26QEE111 pKa = 5.35AINKK115 pKa = 8.36YY116 pKa = 9.11NNSIQAQQQYY126 pKa = 11.06SDD128 pKa = 4.44YY129 pKa = 10.66EE130 pKa = 3.99NQIYY134 pKa = 10.09QSYY137 pKa = 10.86NSYY140 pKa = 11.31
Molecular weight: 16.22 kDa
Isoelectric point according different methods:
Protein with the highest isoelectric point:
>tr|Q4A5J8|Q4A5J8_MYCS5 tRNA pseudouridine(55) synthase OS=Mycoplasma synoviae (strain 53) OX=262723 GN=truB PE=3 SV=1
MM1 pKa = 7.75ANPTQIYY8 pKa = 10.43SRR10 pKa = 11.84DD11 pKa = 3.8SKK13 pKa = 9.86WRR15 pKa = 11.84RR16 pKa = 11.84GVMRR20 pKa = 11.84SLVSEE25 pKa = 4.31LLLHH29 pKa = 6.92GRR31 pKa = 11.84IQTTLTRR38 pKa = 11.84AKK40 pKa = 9.56EE41 pKa = 4.23VRR43 pKa = 11.84GHH45 pKa = 5.96AEE47 pKa = 3.76KK48 pKa = 10.97LITKK52 pKa = 10.18AKK54 pKa = 9.0AQSLASRR61 pKa = 11.84RR62 pKa = 11.84HH63 pKa = 4.95AASFLRR69 pKa = 11.84PLVTKK74 pKa = 10.38DD75 pKa = 3.17NKK77 pKa = 10.11TLLQEE82 pKa = 4.46LFDD85 pKa = 4.73TIAPKK90 pKa = 10.91YY91 pKa = 9.2KK92 pKa = 10.14DD93 pKa = 3.36RR94 pKa = 11.84PGGYY98 pKa = 7.49TRR100 pKa = 11.84IYY102 pKa = 10.29KK103 pKa = 10.08LPKK106 pKa = 9.39RR107 pKa = 11.84DD108 pKa = 3.53GDD110 pKa = 4.0STRR113 pKa = 11.84MALIEE118 pKa = 4.07LVV120 pKa = 3.37
MM1 pKa = 7.75ANPTQIYY8 pKa = 10.43SRR10 pKa = 11.84DD11 pKa = 3.8SKK13 pKa = 9.86WRR15 pKa = 11.84RR16 pKa = 11.84GVMRR20 pKa = 11.84SLVSEE25 pKa = 4.31LLLHH29 pKa = 6.92GRR31 pKa = 11.84IQTTLTRR38 pKa = 11.84AKK40 pKa = 9.56EE41 pKa = 4.23VRR43 pKa = 11.84GHH45 pKa = 5.96AEE47 pKa = 3.76KK48 pKa = 10.97LITKK52 pKa = 10.18AKK54 pKa = 9.0AQSLASRR61 pKa = 11.84RR62 pKa = 11.84HH63 pKa = 4.95AASFLRR69 pKa = 11.84PLVTKK74 pKa = 10.38DD75 pKa = 3.17NKK77 pKa = 10.11TLLQEE82 pKa = 4.46LFDD85 pKa = 4.73TIAPKK90 pKa = 10.91YY91 pKa = 9.2KK92 pKa = 10.14DD93 pKa = 3.36RR94 pKa = 11.84PGGYY98 pKa = 7.49TRR100 pKa = 11.84IYY102 pKa = 10.29KK103 pKa = 10.08LPKK106 pKa = 9.39RR107 pKa = 11.84DD108 pKa = 3.53GDD110 pKa = 4.0STRR113 pKa = 11.84MALIEE118 pKa = 4.07LVV120 pKa = 3.37
Molecular weight: 13.75 kDa
Isoelectric point according different methods:
Peptides (in silico digests for buttom-up proteomics)
Below you can find in silico digests of the whole proteome with Trypsin, Chymotrypsin, Trypsin+LysC, LysN, ArgC proteases suitable for different mass spec machines.| Try ESI |
 |
|---|
| ChTry ESI |
 |
|---|
| ArgC ESI |
 |
|---|
| LysN ESI |
 |
|---|
| TryLysC ESI |
 |
|---|
| Try MALDI |
 |
|---|
| ChTry MALDI |
 |
|---|
| ArgC MALDI |
 |
|---|
| LysN MALDI |
 |
|---|
| TryLysC MALDI |
 |
|---|
| Try LTQ |
 |
|---|
| ChTry LTQ |
 |
|---|
| ArgC LTQ |
 |
|---|
| LysN LTQ |
 |
|---|
| TryLysC LTQ |
 |
|---|
| Try MSlow |
 |
|---|
| ChTry MSlow |
 |
|---|
| ArgC MSlow |
 |
|---|
| LysN MSlow |
 |
|---|
| TryLysC MSlow |
 |
|---|
| Try MShigh |
 |
|---|
| ChTry MShigh |
 |
|---|
| ArgC MShigh |
 |
|---|
| LysN MShigh |
 |
|---|
| TryLysC MShigh |
 |
|---|
General Statistics
Number of major isoforms |
Number of additional isoforms |
Number of all proteins |
Number of amino acids |
Min. Seq. Length |
Max. Seq. Length |
Avg. Seq. Length |
Avg. Mol. Weight |
|---|---|---|---|---|---|---|---|
0 |
236649 |
37 |
2636 |
348.5 |
39.78 |
Amino acid frequency
Ala |
Cys |
Asp |
Glu |
Phe |
Gly |
His |
Ile |
Lys |
Leu |
|---|---|---|---|---|---|---|---|---|---|
5.851 ± 0.12 | 0.4 ± 0.019 |
5.251 ± 0.072 | 6.316 ± 0.102 |
5.899 ± 0.111 | 4.459 ± 0.099 |
1.237 ± 0.037 | 7.906 ± 0.166 |
10.39 ± 0.122 | 10.192 ± 0.111 |
Met |
Asn |
Gln |
Pro |
Arg |
Ser |
Thr |
Val |
Trp |
Tyr |
|---|---|---|---|---|---|---|---|---|---|
1.604 ± 0.037 | 7.889 ± 0.13 |
2.707 ± 0.059 | 3.421 ± 0.053 |
2.705 ± 0.047 | 7.316 ± 0.067 |
5.307 ± 0.104 | 6.068 ± 0.096 |
0.922 ± 0.026 | 4.16 ± 0.067 |
Most of the basic statistics you can see at this page can be downloaded from this CSV file
Proteome-pI is available under Creative Commons Attribution-NoDerivs license, for more details see here
| Reference: Kozlowski LP. Proteome-pI 2.0: Proteome Isoelectric Point Database Update. Nucleic Acids Res. 2021, doi: 10.1093/nar/gkab944 | Contact: Lukasz P. Kozlowski |
