Penguin siadenovirus A
Taxonomy: Viruses; Varidnaviria; Bamfordvirae; Preplasmiviricota; Tectiliviricetes; Rowavirales; Adenoviridae; Siadenovirus
Average proteome isoelectric point is 6.59
Get precalculated fractions of proteins

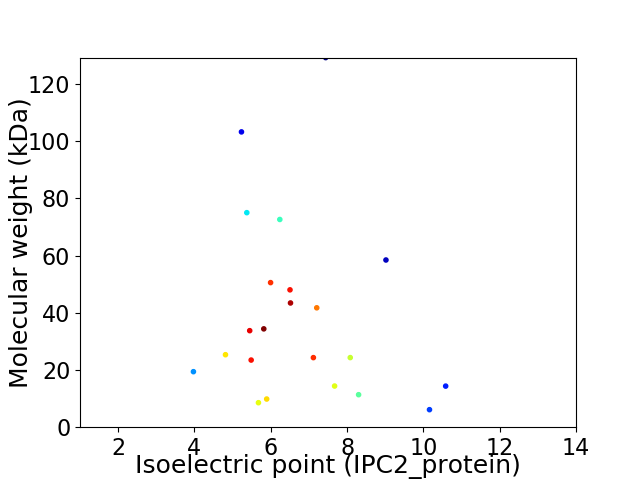
Virtual 2D-PAGE plot for 22 proteins (isoelectric point calculated using IPC2_protein)
Get csv file with sequences according to given criteria:
* You can choose from 21 different methods for calculating isoelectric point
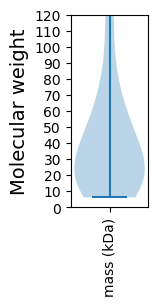
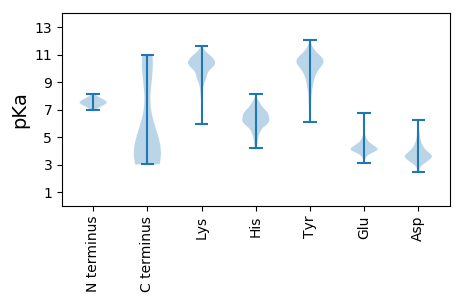
Summary statistics related to proteome-wise predictions


Protein with the lowest isoelectric point:
>tr|A0A162HSM3|A0A162HSM3_9ADEN ORF8 OS=Penguin siadenovirus A OX=2005055 GN=CSPAdV-2_gp22 PE=4 SV=1
MM1 pKa = 7.92DD2 pKa = 5.45SEE4 pKa = 5.59DD5 pKa = 3.91EE6 pKa = 4.34LEE8 pKa = 4.69GPVMLPPLQVHH19 pKa = 7.12RR20 pKa = 11.84ISSTNRR26 pKa = 11.84FTSGTVLDD34 pKa = 4.89LPSMTDD40 pKa = 2.57NCFVYY45 pKa = 10.54NFKK48 pKa = 10.22TPTGEE53 pKa = 4.16TVFIEE58 pKa = 4.58SNGQFKK64 pKa = 10.45FSEE67 pKa = 4.65YY68 pKa = 11.06NFGTLFSGFNDD79 pKa = 3.24VTLEE83 pKa = 3.93MQLDD87 pKa = 3.62FHH89 pKa = 8.11YY90 pKa = 10.55MFDD93 pKa = 4.64CMLDD97 pKa = 3.9FKK99 pKa = 10.68WPNADD104 pKa = 3.76LEE106 pKa = 4.53YY107 pKa = 10.91SVNVYY112 pKa = 7.73TDD114 pKa = 3.21RR115 pKa = 11.84RR116 pKa = 11.84IAIYY120 pKa = 10.4DD121 pKa = 4.17LSNADD126 pKa = 3.56YY127 pKa = 10.24WPTILAWFAWQCNSNGINFFQYY149 pKa = 10.43VRR151 pKa = 11.84LLNEE155 pKa = 4.68DD156 pKa = 5.24DD157 pKa = 4.07EE158 pKa = 4.88GCPYY162 pKa = 9.94GTIFAA167 pKa = 5.2
MM1 pKa = 7.92DD2 pKa = 5.45SEE4 pKa = 5.59DD5 pKa = 3.91EE6 pKa = 4.34LEE8 pKa = 4.69GPVMLPPLQVHH19 pKa = 7.12RR20 pKa = 11.84ISSTNRR26 pKa = 11.84FTSGTVLDD34 pKa = 4.89LPSMTDD40 pKa = 2.57NCFVYY45 pKa = 10.54NFKK48 pKa = 10.22TPTGEE53 pKa = 4.16TVFIEE58 pKa = 4.58SNGQFKK64 pKa = 10.45FSEE67 pKa = 4.65YY68 pKa = 11.06NFGTLFSGFNDD79 pKa = 3.24VTLEE83 pKa = 3.93MQLDD87 pKa = 3.62FHH89 pKa = 8.11YY90 pKa = 10.55MFDD93 pKa = 4.64CMLDD97 pKa = 3.9FKK99 pKa = 10.68WPNADD104 pKa = 3.76LEE106 pKa = 4.53YY107 pKa = 10.91SVNVYY112 pKa = 7.73TDD114 pKa = 3.21RR115 pKa = 11.84RR116 pKa = 11.84IAIYY120 pKa = 10.4DD121 pKa = 4.17LSNADD126 pKa = 3.56YY127 pKa = 10.24WPTILAWFAWQCNSNGINFFQYY149 pKa = 10.43VRR151 pKa = 11.84LLNEE155 pKa = 4.68DD156 pKa = 5.24DD157 pKa = 4.07EE158 pKa = 4.88GCPYY162 pKa = 9.94GTIFAA167 pKa = 5.2
Molecular weight: 19.41 kDa
Isoelectric point according different methods:
Protein with the highest isoelectric point:
>tr|A0A162HSI2|A0A162HSI2_9ADEN Core protein pX OS=Penguin siadenovirus A OX=2005055 GN=CSPAdV-2_gp09 PE=4 SV=1
MM1 pKa = 7.22TSIVYY6 pKa = 10.4SPADD10 pKa = 3.3SRR12 pKa = 11.84GWGFGNSSMRR22 pKa = 11.84DD23 pKa = 3.45YY24 pKa = 11.51YY25 pKa = 11.25LIGGALEE32 pKa = 4.36PSDD35 pKa = 3.52IYY37 pKa = 9.13TVRR40 pKa = 11.84VRR42 pKa = 11.84EE43 pKa = 3.76HH44 pKa = 5.23WRR46 pKa = 11.84RR47 pKa = 11.84KK48 pKa = 6.71QRR50 pKa = 11.84RR51 pKa = 11.84KK52 pKa = 9.88SAAVQATPVVVAPVRR67 pKa = 11.84RR68 pKa = 11.84PRR70 pKa = 11.84RR71 pKa = 11.84RR72 pKa = 11.84RR73 pKa = 11.84AVGVQVPSTRR83 pKa = 11.84VLRR86 pKa = 11.84SATRR90 pKa = 11.84RR91 pKa = 11.84LAPVVPALPAPAVVPALPAPVAPVAAAIPTVSAPVKK127 pKa = 9.93RR128 pKa = 11.84RR129 pKa = 11.84RR130 pKa = 11.84IGG132 pKa = 3.09
MM1 pKa = 7.22TSIVYY6 pKa = 10.4SPADD10 pKa = 3.3SRR12 pKa = 11.84GWGFGNSSMRR22 pKa = 11.84DD23 pKa = 3.45YY24 pKa = 11.51YY25 pKa = 11.25LIGGALEE32 pKa = 4.36PSDD35 pKa = 3.52IYY37 pKa = 9.13TVRR40 pKa = 11.84VRR42 pKa = 11.84EE43 pKa = 3.76HH44 pKa = 5.23WRR46 pKa = 11.84RR47 pKa = 11.84KK48 pKa = 6.71QRR50 pKa = 11.84RR51 pKa = 11.84KK52 pKa = 9.88SAAVQATPVVVAPVRR67 pKa = 11.84RR68 pKa = 11.84PRR70 pKa = 11.84RR71 pKa = 11.84RR72 pKa = 11.84RR73 pKa = 11.84AVGVQVPSTRR83 pKa = 11.84VLRR86 pKa = 11.84SATRR90 pKa = 11.84RR91 pKa = 11.84LAPVVPALPAPAVVPALPAPVAPVAAAIPTVSAPVKK127 pKa = 9.93RR128 pKa = 11.84RR129 pKa = 11.84RR130 pKa = 11.84IGG132 pKa = 3.09
Molecular weight: 14.36 kDa
Isoelectric point according different methods:
Peptides (in silico digests for buttom-up proteomics)
Below you can find in silico digests of the whole proteome with Trypsin, Chymotrypsin, Trypsin+LysC, LysN, ArgC proteases suitable for different mass spec machines.| Try ESI |
 |
|---|
| ChTry ESI |
 |
|---|
| ArgC ESI |
 |
|---|
| LysN ESI |
 |
|---|
| TryLysC ESI |
 |
|---|
| Try MALDI |
 |
|---|
| ChTry MALDI |
 |
|---|
| ArgC MALDI |
 |
|---|
| LysN MALDI |
 |
|---|
| TryLysC MALDI |
 |
|---|
| Try LTQ |
 |
|---|
| ChTry LTQ |
 |
|---|
| ArgC LTQ |
 |
|---|
| LysN LTQ |
 |
|---|
| TryLysC LTQ |
 |
|---|
| Try MSlow |
 |
|---|
| ChTry MSlow |
 |
|---|
| ArgC MSlow |
 |
|---|
| LysN MSlow |
 |
|---|
| TryLysC MSlow |
 |
|---|
| Try MShigh |
 |
|---|
| ChTry MShigh |
 |
|---|
| ArgC MShigh |
 |
|---|
| LysN MShigh |
 |
|---|
| TryLysC MShigh |
 |
|---|
General Statistics
Number of major isoforms |
Number of additional isoforms |
Number of all proteins |
Number of amino acids |
Min. Seq. Length |
Max. Seq. Length |
Avg. Seq. Length |
Avg. Mol. Weight |
|---|---|---|---|---|---|---|---|
0 |
7646 |
57 |
1108 |
347.5 |
39.63 |
Amino acid frequency
Ala |
Cys |
Asp |
Glu |
Phe |
Gly |
His |
Ile |
Lys |
Leu |
|---|---|---|---|---|---|---|---|---|---|
5.428 ± 0.381 | 2.106 ± 0.453 |
5.31 ± 0.261 | 5.467 ± 0.373 |
5.166 ± 0.217 | 4.551 ± 0.446 |
2.04 ± 0.255 | 6.762 ± 0.4 |
5.82 ± 0.693 | 9.639 ± 0.602 |
Met |
Asn |
Gln |
Pro |
Arg |
Ser |
Thr |
Val |
Trp |
Tyr |
|---|---|---|---|---|---|---|---|---|---|
2.354 ± 0.184 | 6.539 ± 0.325 |
5.323 ± 0.319 | 4.578 ± 0.279 |
4.8 ± 0.481 | 7.219 ± 0.289 |
6.474 ± 0.439 | 5.31 ± 0.364 |
1.02 ± 0.099 | 4.094 ± 0.299 |
Most of the basic statistics you can see at this page can be downloaded from this CSV file
Proteome-pI is available under Creative Commons Attribution-NoDerivs license, for more details see here
| Reference: Kozlowski LP. Proteome-pI 2.0: Proteome Isoelectric Point Database Update. Nucleic Acids Res. 2021, doi: 10.1093/nar/gkab944 | Contact: Lukasz P. Kozlowski |
