Dibothriocephalus latus (Fish tapeworm) (Diphyllobothrium latum)
Taxonomy: cellular organisms; Eukaryota; Opisthokonta; Metazoa; Eumetazoa; Bilateria; Protostomia; Spiralia; Lophotrochozoa; Platyhelminthes; Cestoda; Eucestoda; Diphyllobothriidea; Diphyllobothriidae; Dibothriocephalus
Average proteome isoelectric point is 6.63
Get precalculated fractions of proteins

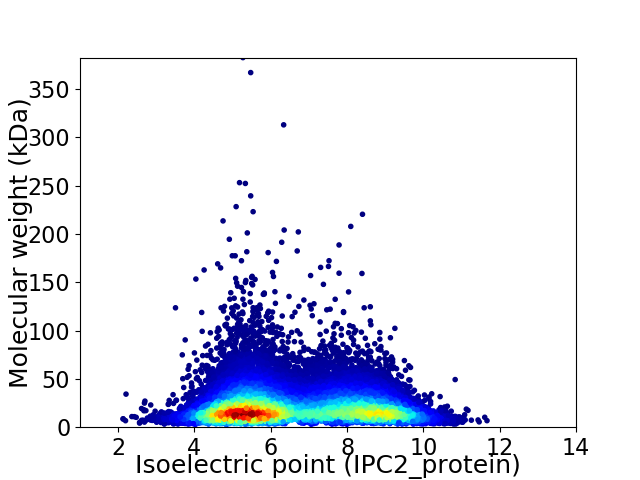
Virtual 2D-PAGE plot for 19927 proteins (isoelectric point calculated using IPC2_protein)
Get csv file with sequences according to given criteria:
* You can choose from 21 different methods for calculating isoelectric point
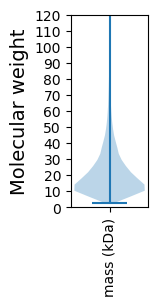
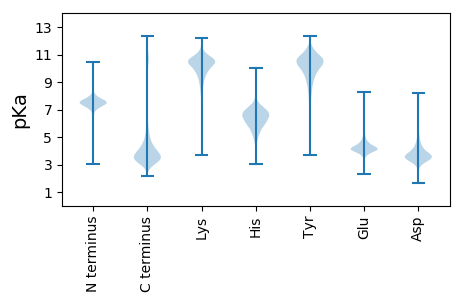
Summary statistics related to proteome-wise predictions


Protein with the lowest isoelectric point:
>tr|A0A3P7LJM4|A0A3P7LJM4_DIBLA Mediator of RNA polymerase II transcription subunit 8 OS=Dibothriocephalus latus OX=60516 GN=MED8 PE=3 SV=1
MM1 pKa = 7.94DD2 pKa = 3.13VTEE5 pKa = 4.39TVEE8 pKa = 3.73ITSPVLQVNDD18 pKa = 3.77TQTSKK23 pKa = 10.99LVPPQGSVTTSVPSTFLPDD42 pKa = 4.06DD43 pKa = 4.7LGSTTPMMPTEE54 pKa = 4.52DD55 pKa = 3.38SAVTVTEE62 pKa = 4.16TVPVSTMEE70 pKa = 4.18SLSTEE75 pKa = 4.26SEE77 pKa = 4.61TVASIPNVTSEE88 pKa = 3.99IPRR91 pKa = 11.84VSDD94 pKa = 3.01IVVTIPSTEE103 pKa = 4.16AYY105 pKa = 8.8VSSVATEE112 pKa = 4.59TIPSTEE118 pKa = 4.18EE119 pKa = 3.61LATAPLSTSEE129 pKa = 4.43IPDD132 pKa = 3.69TNMSAMQTPSVPTVISTAMPEE153 pKa = 4.62LIGSTATTTTAGTTTDD169 pKa = 3.32VPEE172 pKa = 5.31PDD174 pKa = 3.71LAMTTDD180 pKa = 3.25TAVPVISTGPQTGQTDD196 pKa = 4.12PPTVTTASTPRR207 pKa = 11.84LEE209 pKa = 4.75VSTLPPSVIISEE221 pKa = 4.42SGGTTFPVDD230 pKa = 3.42PFNTTRR236 pKa = 11.84SPDD239 pKa = 3.37VAGATTPKK247 pKa = 9.21STSPGLPGYY256 pKa = 10.26VLLGSAGMPDD266 pKa = 2.78WRR268 pKa = 11.84LYY270 pKa = 11.16LIMVSVIALALIMIMLIGWIITCVCMRR297 pKa = 11.84VSSSCLFYY305 pKa = 11.08YY306 pKa = 10.07YY307 pKa = 9.56ISHH310 pKa = 6.46SGYY313 pKa = 10.07IKK315 pKa = 10.53VSAIGGGAEE324 pKa = 3.77
MM1 pKa = 7.94DD2 pKa = 3.13VTEE5 pKa = 4.39TVEE8 pKa = 3.73ITSPVLQVNDD18 pKa = 3.77TQTSKK23 pKa = 10.99LVPPQGSVTTSVPSTFLPDD42 pKa = 4.06DD43 pKa = 4.7LGSTTPMMPTEE54 pKa = 4.52DD55 pKa = 3.38SAVTVTEE62 pKa = 4.16TVPVSTMEE70 pKa = 4.18SLSTEE75 pKa = 4.26SEE77 pKa = 4.61TVASIPNVTSEE88 pKa = 3.99IPRR91 pKa = 11.84VSDD94 pKa = 3.01IVVTIPSTEE103 pKa = 4.16AYY105 pKa = 8.8VSSVATEE112 pKa = 4.59TIPSTEE118 pKa = 4.18EE119 pKa = 3.61LATAPLSTSEE129 pKa = 4.43IPDD132 pKa = 3.69TNMSAMQTPSVPTVISTAMPEE153 pKa = 4.62LIGSTATTTTAGTTTDD169 pKa = 3.32VPEE172 pKa = 5.31PDD174 pKa = 3.71LAMTTDD180 pKa = 3.25TAVPVISTGPQTGQTDD196 pKa = 4.12PPTVTTASTPRR207 pKa = 11.84LEE209 pKa = 4.75VSTLPPSVIISEE221 pKa = 4.42SGGTTFPVDD230 pKa = 3.42PFNTTRR236 pKa = 11.84SPDD239 pKa = 3.37VAGATTPKK247 pKa = 9.21STSPGLPGYY256 pKa = 10.26VLLGSAGMPDD266 pKa = 2.78WRR268 pKa = 11.84LYY270 pKa = 11.16LIMVSVIALALIMIMLIGWIITCVCMRR297 pKa = 11.84VSSSCLFYY305 pKa = 11.08YY306 pKa = 10.07YY307 pKa = 9.56ISHH310 pKa = 6.46SGYY313 pKa = 10.07IKK315 pKa = 10.53VSAIGGGAEE324 pKa = 3.77
Molecular weight: 33.61 kDa
Isoelectric point according different methods:
Protein with the highest isoelectric point:
>tr|A0A3P7MPL3|A0A3P7MPL3_DIBLA PKD_channel domain-containing protein OS=Dibothriocephalus latus OX=60516 GN=DILT_LOCUS13546 PE=3 SV=1
MM1 pKa = 8.19RR2 pKa = 11.84ITRR5 pKa = 11.84IPQRR9 pKa = 11.84KK10 pKa = 8.35FLPKK14 pKa = 10.23NPLLRR19 pKa = 11.84IHH21 pKa = 5.89QLQRR25 pKa = 11.84TKK27 pKa = 10.8SRR29 pKa = 11.84RR30 pKa = 11.84QLRR33 pKa = 11.84TKK35 pKa = 10.24RR36 pKa = 11.84IPVRR40 pKa = 11.84KK41 pKa = 8.49FQSKK45 pKa = 10.06HH46 pKa = 5.4PSLSIHH52 pKa = 5.23QLQRR56 pKa = 11.84AKK58 pKa = 10.85LL59 pKa = 3.62
MM1 pKa = 8.19RR2 pKa = 11.84ITRR5 pKa = 11.84IPQRR9 pKa = 11.84KK10 pKa = 8.35FLPKK14 pKa = 10.23NPLLRR19 pKa = 11.84IHH21 pKa = 5.89QLQRR25 pKa = 11.84TKK27 pKa = 10.8SRR29 pKa = 11.84RR30 pKa = 11.84QLRR33 pKa = 11.84TKK35 pKa = 10.24RR36 pKa = 11.84IPVRR40 pKa = 11.84KK41 pKa = 8.49FQSKK45 pKa = 10.06HH46 pKa = 5.4PSLSIHH52 pKa = 5.23QLQRR56 pKa = 11.84AKK58 pKa = 10.85LL59 pKa = 3.62
Molecular weight: 7.26 kDa
Isoelectric point according different methods:
Peptides (in silico digests for buttom-up proteomics)
Below you can find in silico digests of the whole proteome with Trypsin, Chymotrypsin, Trypsin+LysC, LysN, ArgC proteases suitable for different mass spec machines.| Try ESI |
 |
|---|
| ChTry ESI |
 |
|---|
| ArgC ESI |
 |
|---|
| LysN ESI |
 |
|---|
| TryLysC ESI |
 |
|---|
| Try MALDI |
 |
|---|
| ChTry MALDI |
 |
|---|
| ArgC MALDI |
 |
|---|
| LysN MALDI |
 |
|---|
| TryLysC MALDI |
 |
|---|
| Try LTQ |
 |
|---|
| ChTry LTQ |
 |
|---|
| ArgC LTQ |
 |
|---|
| LysN LTQ |
 |
|---|
| TryLysC LTQ |
 |
|---|
| Try MSlow |
 |
|---|
| ChTry MSlow |
 |
|---|
| ArgC MSlow |
 |
|---|
| LysN MSlow |
 |
|---|
| TryLysC MSlow |
 |
|---|
| Try MShigh |
 |
|---|
| ChTry MShigh |
 |
|---|
| ArgC MShigh |
 |
|---|
| LysN MShigh |
 |
|---|
| TryLysC MShigh |
 |
|---|
General Statistics
Number of major isoforms |
Number of additional isoforms |
Number of all proteins |
Number of amino acids |
Min. Seq. Length |
Max. Seq. Length |
Avg. Seq. Length |
Avg. Mol. Weight |
|---|---|---|---|---|---|---|---|
0 |
4139272 |
29 |
3531 |
207.7 |
23.1 |
Amino acid frequency
Ala |
Cys |
Asp |
Glu |
Phe |
Gly |
His |
Ile |
Lys |
Leu |
|---|---|---|---|---|---|---|---|---|---|
7.542 ± 0.018 | 2.133 ± 0.012 |
5.276 ± 0.018 | 6.217 ± 0.023 |
4.253 ± 0.017 | 5.434 ± 0.019 |
2.33 ± 0.011 | 4.821 ± 0.017 |
4.949 ± 0.02 | 10.127 ± 0.027 |
Met |
Asn |
Gln |
Pro |
Arg |
Ser |
Thr |
Val |
Trp |
Tyr |
|---|---|---|---|---|---|---|---|---|---|
2.353 ± 0.014 | 3.892 ± 0.011 |
5.659 ± 0.019 | 3.98 ± 0.015 |
5.965 ± 0.016 | 8.506 ± 0.026 |
5.834 ± 0.014 | 6.424 ± 0.016 |
1.107 ± 0.006 | 2.737 ± 0.011 |
Most of the basic statistics you can see at this page can be downloaded from this CSV file
Proteome-pI is available under Creative Commons Attribution-NoDerivs license, for more details see here
| Reference: Kozlowski LP. Proteome-pI 2.0: Proteome Isoelectric Point Database Update. Nucleic Acids Res. 2021, doi: 10.1093/nar/gkab944 | Contact: Lukasz P. Kozlowski |
