Streptomyces sp. BK239
Taxonomy: cellular organisms; Bacteria; Terrabacteria group; Actinobacteria; Actinomycetia; Streptomycetales; Streptomycetaceae; Streptomyces; unclassified Streptomyces
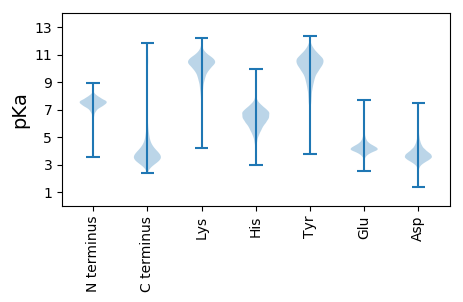
Average proteome isoelectric point is 6.44
Get precalculated fractions of proteins

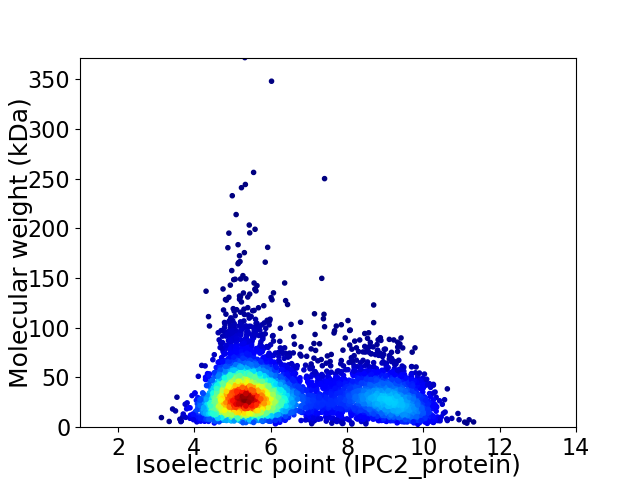
Virtual 2D-PAGE plot for 5360 proteins (isoelectric point calculated using IPC2_protein)
Get csv file with sequences according to given criteria:
* You can choose from 21 different methods for calculating isoelectric point
Summary statistics related to proteome-wise predictions


Protein with the lowest isoelectric point:
>tr|A0A4Q7XPQ3|A0A4Q7XPQ3_9ACTN Penicillin-insensitive transglycosylase OS=Streptomyces sp. BK239 OX=2512155 GN=EV567_0606 PE=4 SV=1
MM1 pKa = 7.57RR2 pKa = 11.84QTLTRR7 pKa = 11.84GMIAAAAATSLLSLCGGAAYY27 pKa = 10.25ADD29 pKa = 3.8SSADD33 pKa = 3.33GTATGSPGAVSGAGVQSPVTLPASLCGDD61 pKa = 3.81TAGLAAAFGQALGDD75 pKa = 4.13FCADD79 pKa = 3.41TSDD82 pKa = 3.65EE83 pKa = 4.39TSTSDD88 pKa = 4.8AADD91 pKa = 3.43TSDD94 pKa = 5.31AEE96 pKa = 4.39DD97 pKa = 3.52TADD100 pKa = 3.54EE101 pKa = 4.56AKK103 pKa = 8.21TTEE106 pKa = 4.45DD107 pKa = 3.73ASTSAPADD115 pKa = 3.32GAARR119 pKa = 11.84ADD121 pKa = 3.74EE122 pKa = 4.38ATSAGADD129 pKa = 3.55SDD131 pKa = 4.82SDD133 pKa = 3.95HH134 pKa = 7.39ADD136 pKa = 3.22PGYY139 pKa = 11.18GEE141 pKa = 4.83DD142 pKa = 4.11PGYY145 pKa = 11.18GNPPHH150 pKa = 7.12EE151 pKa = 5.36DD152 pKa = 3.66DD153 pKa = 3.99EE154 pKa = 5.45PGYY157 pKa = 10.98GDD159 pKa = 4.38PGQGGDD165 pKa = 4.06KK166 pKa = 10.79DD167 pKa = 3.72PGYY170 pKa = 10.66GGHH173 pKa = 7.11HH174 pKa = 7.31DD175 pKa = 4.28GDD177 pKa = 3.98PGYY180 pKa = 11.05GGDD183 pKa = 4.79DD184 pKa = 3.7GPGYY188 pKa = 11.03GDD190 pKa = 5.61DD191 pKa = 4.9DD192 pKa = 5.21DD193 pKa = 5.94SGYY196 pKa = 11.44GSDD199 pKa = 5.19DD200 pKa = 3.6GPGYY204 pKa = 11.13GDD206 pKa = 4.91DD207 pKa = 3.8DD208 pKa = 4.1SGYY211 pKa = 11.22GSDD214 pKa = 5.19DD215 pKa = 3.6GPGYY219 pKa = 11.07GDD221 pKa = 5.61DD222 pKa = 4.9DD223 pKa = 5.17DD224 pKa = 5.95SGYY227 pKa = 11.32GSTPPPPGGPVTPPEE242 pKa = 4.75GGHH245 pKa = 5.25TTPHH249 pKa = 7.12DD250 pKa = 4.41PPPPGDD256 pKa = 4.76DD257 pKa = 4.08DD258 pKa = 5.55HH259 pKa = 6.56GTPPGEE265 pKa = 4.47EE266 pKa = 4.01NNEE269 pKa = 3.91PRR271 pKa = 11.84PQLPEE276 pKa = 3.98TGSEE280 pKa = 4.21SLLAASGVSAALITAGALLYY300 pKa = 10.54RR301 pKa = 11.84RR302 pKa = 11.84GRR304 pKa = 11.84AASRR308 pKa = 11.84RR309 pKa = 3.88
MM1 pKa = 7.57RR2 pKa = 11.84QTLTRR7 pKa = 11.84GMIAAAAATSLLSLCGGAAYY27 pKa = 10.25ADD29 pKa = 3.8SSADD33 pKa = 3.33GTATGSPGAVSGAGVQSPVTLPASLCGDD61 pKa = 3.81TAGLAAAFGQALGDD75 pKa = 4.13FCADD79 pKa = 3.41TSDD82 pKa = 3.65EE83 pKa = 4.39TSTSDD88 pKa = 4.8AADD91 pKa = 3.43TSDD94 pKa = 5.31AEE96 pKa = 4.39DD97 pKa = 3.52TADD100 pKa = 3.54EE101 pKa = 4.56AKK103 pKa = 8.21TTEE106 pKa = 4.45DD107 pKa = 3.73ASTSAPADD115 pKa = 3.32GAARR119 pKa = 11.84ADD121 pKa = 3.74EE122 pKa = 4.38ATSAGADD129 pKa = 3.55SDD131 pKa = 4.82SDD133 pKa = 3.95HH134 pKa = 7.39ADD136 pKa = 3.22PGYY139 pKa = 11.18GEE141 pKa = 4.83DD142 pKa = 4.11PGYY145 pKa = 11.18GNPPHH150 pKa = 7.12EE151 pKa = 5.36DD152 pKa = 3.66DD153 pKa = 3.99EE154 pKa = 5.45PGYY157 pKa = 10.98GDD159 pKa = 4.38PGQGGDD165 pKa = 4.06KK166 pKa = 10.79DD167 pKa = 3.72PGYY170 pKa = 10.66GGHH173 pKa = 7.11HH174 pKa = 7.31DD175 pKa = 4.28GDD177 pKa = 3.98PGYY180 pKa = 11.05GGDD183 pKa = 4.79DD184 pKa = 3.7GPGYY188 pKa = 11.03GDD190 pKa = 5.61DD191 pKa = 4.9DD192 pKa = 5.21DD193 pKa = 5.94SGYY196 pKa = 11.44GSDD199 pKa = 5.19DD200 pKa = 3.6GPGYY204 pKa = 11.13GDD206 pKa = 4.91DD207 pKa = 3.8DD208 pKa = 4.1SGYY211 pKa = 11.22GSDD214 pKa = 5.19DD215 pKa = 3.6GPGYY219 pKa = 11.07GDD221 pKa = 5.61DD222 pKa = 4.9DD223 pKa = 5.17DD224 pKa = 5.95SGYY227 pKa = 11.32GSTPPPPGGPVTPPEE242 pKa = 4.75GGHH245 pKa = 5.25TTPHH249 pKa = 7.12DD250 pKa = 4.41PPPPGDD256 pKa = 4.76DD257 pKa = 4.08DD258 pKa = 5.55HH259 pKa = 6.56GTPPGEE265 pKa = 4.47EE266 pKa = 4.01NNEE269 pKa = 3.91PRR271 pKa = 11.84PQLPEE276 pKa = 3.98TGSEE280 pKa = 4.21SLLAASGVSAALITAGALLYY300 pKa = 10.54RR301 pKa = 11.84RR302 pKa = 11.84GRR304 pKa = 11.84AASRR308 pKa = 11.84RR309 pKa = 3.88
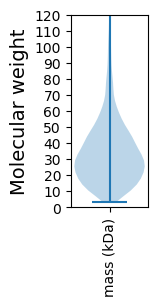
Molecular weight: 30.18 kDa
Isoelectric point according different methods:
Protein with the highest isoelectric point:
>tr|A0A4Q7XFA3|A0A4Q7XFA3_9ACTN Parallel beta helix pectate lyase-like protein OS=Streptomyces sp. BK239 OX=2512155 GN=EV567_2076 PE=4 SV=1
MM1 pKa = 7.69SKK3 pKa = 9.0RR4 pKa = 11.84TFQPNNRR11 pKa = 11.84RR12 pKa = 11.84RR13 pKa = 11.84AKK15 pKa = 8.7THH17 pKa = 5.15GFRR20 pKa = 11.84LRR22 pKa = 11.84MRR24 pKa = 11.84TRR26 pKa = 11.84AGRR29 pKa = 11.84AILASRR35 pKa = 11.84RR36 pKa = 11.84SKK38 pKa = 10.75GRR40 pKa = 11.84ARR42 pKa = 11.84LSAA45 pKa = 3.91
MM1 pKa = 7.69SKK3 pKa = 9.0RR4 pKa = 11.84TFQPNNRR11 pKa = 11.84RR12 pKa = 11.84RR13 pKa = 11.84AKK15 pKa = 8.7THH17 pKa = 5.15GFRR20 pKa = 11.84LRR22 pKa = 11.84MRR24 pKa = 11.84TRR26 pKa = 11.84AGRR29 pKa = 11.84AILASRR35 pKa = 11.84RR36 pKa = 11.84SKK38 pKa = 10.75GRR40 pKa = 11.84ARR42 pKa = 11.84LSAA45 pKa = 3.91
Molecular weight: 5.28 kDa
Isoelectric point according different methods:
Peptides (in silico digests for buttom-up proteomics)
Below you can find in silico digests of the whole proteome with Trypsin, Chymotrypsin, Trypsin+LysC, LysN, ArgC proteases suitable for different mass spec machines.| Try ESI |
 |
|---|
| ChTry ESI |
 |
|---|
| ArgC ESI |
 |
|---|
| LysN ESI |
 |
|---|
| TryLysC ESI |
 |
|---|
| Try MALDI |
 |
|---|
| ChTry MALDI |
 |
|---|
| ArgC MALDI |
 |
|---|
| LysN MALDI |
 |
|---|
| TryLysC MALDI |
 |
|---|
| Try LTQ |
 |
|---|
| ChTry LTQ |
 |
|---|
| ArgC LTQ |
 |
|---|
| LysN LTQ |
 |
|---|
| TryLysC LTQ |
 |
|---|
| Try MSlow |
 |
|---|
| ChTry MSlow |
 |
|---|
| ArgC MSlow |
 |
|---|
| LysN MSlow |
 |
|---|
| TryLysC MSlow |
 |
|---|
| Try MShigh |
 |
|---|
| ChTry MShigh |
 |
|---|
| ArgC MShigh |
 |
|---|
| LysN MShigh |
 |
|---|
| TryLysC MShigh |
 |
|---|
General Statistics
Number of major isoforms |
Number of additional isoforms |
Number of all proteins |
Number of amino acids |
Min. Seq. Length |
Max. Seq. Length |
Avg. Seq. Length |
Avg. Mol. Weight |
|---|---|---|---|---|---|---|---|
0 |
1794248 |
29 |
3538 |
334.7 |
35.8 |
Amino acid frequency
Ala |
Cys |
Asp |
Glu |
Phe |
Gly |
His |
Ile |
Lys |
Leu |
|---|---|---|---|---|---|---|---|---|---|
13.81 ± 0.049 | 0.773 ± 0.01 |
5.994 ± 0.026 | 5.787 ± 0.035 |
2.666 ± 0.02 | 9.524 ± 0.032 |
2.28 ± 0.018 | 2.959 ± 0.023 |
2.288 ± 0.025 | 10.169 ± 0.045 |
Met |
Asn |
Gln |
Pro |
Arg |
Ser |
Thr |
Val |
Trp |
Tyr |
|---|---|---|---|---|---|---|---|---|---|
1.699 ± 0.012 | 1.732 ± 0.019 |
6.206 ± 0.032 | 2.766 ± 0.019 |
8.147 ± 0.04 | 5.046 ± 0.026 |
6.04 ± 0.033 | 8.571 ± 0.029 |
1.487 ± 0.014 | 2.055 ± 0.017 |
Most of the basic statistics you can see at this page can be downloaded from this CSV file
Proteome-pI is available under Creative Commons Attribution-NoDerivs license, for more details see here
| Reference: Kozlowski LP. Proteome-pI 2.0: Proteome Isoelectric Point Database Update. Nucleic Acids Res. 2021, doi: 10.1093/nar/gkab944 | Contact: Lukasz P. Kozlowski |
