Bombilactobacillus mellifer
Taxonomy: cellular organisms; Bacteria; Terrabacteria group; Firmicutes; Bacilli; Lactobacillales; Lactobacillaceae; Bombilactobacillus
Average proteome isoelectric point is 6.94
Get precalculated fractions of proteins

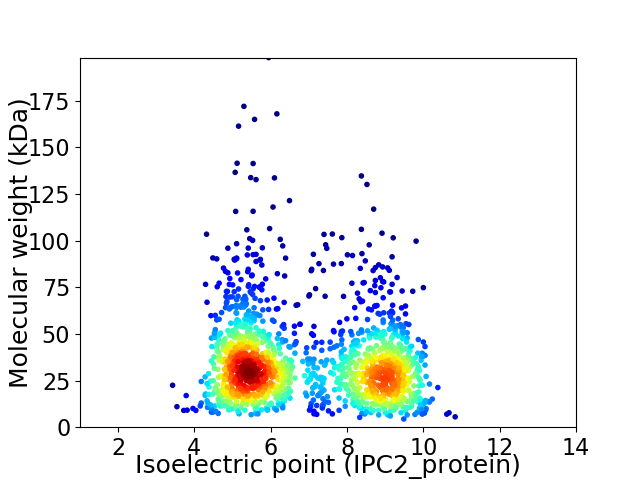
Virtual 2D-PAGE plot for 1592 proteins (isoelectric point calculated using IPC2_protein)
Get csv file with sequences according to given criteria:
* You can choose from 21 different methods for calculating isoelectric point
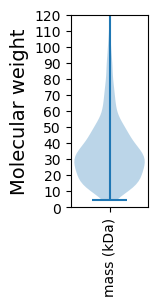
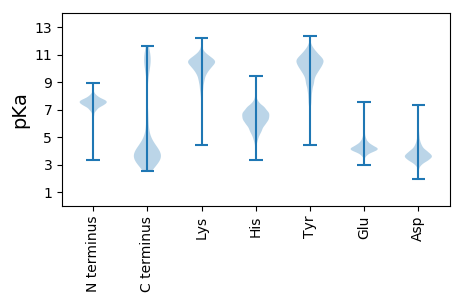
Summary statistics related to proteome-wise predictions


Protein with the lowest isoelectric point:
>tr|A0A0F4LV45|A0A0F4LV45_9LACO Teichoic acid D-alanyltransferase OS=Bombilactobacillus mellifer OX=1218492 GN=JG30_04260 PE=3 SV=1
MM1 pKa = 6.88TQQSEE6 pKa = 4.57NNVDD10 pKa = 3.52QEE12 pKa = 4.74IILSDD17 pKa = 3.8EE18 pKa = 4.07QGHH21 pKa = 4.21QARR24 pKa = 11.84YY25 pKa = 9.76KK26 pKa = 10.4ILFTFDD32 pKa = 3.16SEE34 pKa = 5.59DD35 pKa = 3.42YY36 pKa = 10.25GKK38 pKa = 10.85SYY40 pKa = 11.07VLLYY44 pKa = 10.59LASQEE49 pKa = 3.9NAAEE53 pKa = 4.11IEE55 pKa = 3.98IQAFSFQPDD64 pKa = 3.18ANGDD68 pKa = 3.59VTAGDD73 pKa = 4.48LEE75 pKa = 4.92PIEE78 pKa = 6.14DD79 pKa = 4.09DD80 pKa = 5.29DD81 pKa = 3.79EE82 pKa = 4.23WAMVQEE88 pKa = 4.19VLNTFSAEE96 pKa = 3.98EE97 pKa = 3.87
MM1 pKa = 6.88TQQSEE6 pKa = 4.57NNVDD10 pKa = 3.52QEE12 pKa = 4.74IILSDD17 pKa = 3.8EE18 pKa = 4.07QGHH21 pKa = 4.21QARR24 pKa = 11.84YY25 pKa = 9.76KK26 pKa = 10.4ILFTFDD32 pKa = 3.16SEE34 pKa = 5.59DD35 pKa = 3.42YY36 pKa = 10.25GKK38 pKa = 10.85SYY40 pKa = 11.07VLLYY44 pKa = 10.59LASQEE49 pKa = 3.9NAAEE53 pKa = 4.11IEE55 pKa = 3.98IQAFSFQPDD64 pKa = 3.18ANGDD68 pKa = 3.59VTAGDD73 pKa = 4.48LEE75 pKa = 4.92PIEE78 pKa = 6.14DD79 pKa = 4.09DD80 pKa = 5.29DD81 pKa = 3.79EE82 pKa = 4.23WAMVQEE88 pKa = 4.19VLNTFSAEE96 pKa = 3.98EE97 pKa = 3.87
Molecular weight: 11.0 kDa
Isoelectric point according different methods:
Protein with the highest isoelectric point:
>tr|A0A0F4LPL0|A0A0F4LPL0_9LACO Pyruvate oxidase OS=Bombilactobacillus mellifer OX=1218492 GN=JG30_14570 PE=3 SV=1
MM1 pKa = 6.27QQPRR5 pKa = 11.84RR6 pKa = 11.84RR7 pKa = 11.84RR8 pKa = 11.84NVYY11 pKa = 9.51PIKK14 pKa = 10.68LNNSDD19 pKa = 4.09ASAEE23 pKa = 4.2NKK25 pKa = 9.37FKK27 pKa = 10.96RR28 pKa = 11.84RR29 pKa = 11.84IIQVHH34 pKa = 5.21RR35 pKa = 11.84RR36 pKa = 11.84RR37 pKa = 11.84ITLLLAVGLVILVALGSRR55 pKa = 11.84VVQAQQEE62 pKa = 4.36RR63 pKa = 11.84EE64 pKa = 3.89QTRR67 pKa = 11.84VEE69 pKa = 4.34FNQHH73 pKa = 4.82QKK75 pKa = 10.77RR76 pKa = 11.84LQQTKK81 pKa = 9.37QKK83 pKa = 10.1QANLQTEE90 pKa = 4.61VRR92 pKa = 11.84QLHH95 pKa = 5.3NPEE98 pKa = 4.22YY99 pKa = 10.45LDD101 pKa = 3.2NLIRR105 pKa = 11.84YY106 pKa = 7.39RR107 pKa = 11.84FNYY110 pKa = 10.4SKK112 pKa = 11.08DD113 pKa = 3.19NEE115 pKa = 4.44IIYY118 pKa = 9.2NIPNEE123 pKa = 4.1ANQNLNFF130 pKa = 4.17
MM1 pKa = 6.27QQPRR5 pKa = 11.84RR6 pKa = 11.84RR7 pKa = 11.84RR8 pKa = 11.84NVYY11 pKa = 9.51PIKK14 pKa = 10.68LNNSDD19 pKa = 4.09ASAEE23 pKa = 4.2NKK25 pKa = 9.37FKK27 pKa = 10.96RR28 pKa = 11.84RR29 pKa = 11.84IIQVHH34 pKa = 5.21RR35 pKa = 11.84RR36 pKa = 11.84RR37 pKa = 11.84ITLLLAVGLVILVALGSRR55 pKa = 11.84VVQAQQEE62 pKa = 4.36RR63 pKa = 11.84EE64 pKa = 3.89QTRR67 pKa = 11.84VEE69 pKa = 4.34FNQHH73 pKa = 4.82QKK75 pKa = 10.77RR76 pKa = 11.84LQQTKK81 pKa = 9.37QKK83 pKa = 10.1QANLQTEE90 pKa = 4.61VRR92 pKa = 11.84QLHH95 pKa = 5.3NPEE98 pKa = 4.22YY99 pKa = 10.45LDD101 pKa = 3.2NLIRR105 pKa = 11.84YY106 pKa = 7.39RR107 pKa = 11.84FNYY110 pKa = 10.4SKK112 pKa = 11.08DD113 pKa = 3.19NEE115 pKa = 4.44IIYY118 pKa = 9.2NIPNEE123 pKa = 4.1ANQNLNFF130 pKa = 4.17
Molecular weight: 15.64 kDa
Isoelectric point according different methods:
Peptides (in silico digests for buttom-up proteomics)
Below you can find in silico digests of the whole proteome with Trypsin, Chymotrypsin, Trypsin+LysC, LysN, ArgC proteases suitable for different mass spec machines.| Try ESI |
 |
|---|
| ChTry ESI |
 |
|---|
| ArgC ESI |
 |
|---|
| LysN ESI |
 |
|---|
| TryLysC ESI |
 |
|---|
| Try MALDI |
 |
|---|
| ChTry MALDI |
 |
|---|
| ArgC MALDI |
 |
|---|
| LysN MALDI |
 |
|---|
| TryLysC MALDI |
 |
|---|
| Try LTQ |
 |
|---|
| ChTry LTQ |
 |
|---|
| ArgC LTQ |
 |
|---|
| LysN LTQ |
 |
|---|
| TryLysC LTQ |
 |
|---|
| Try MSlow |
 |
|---|
| ChTry MSlow |
 |
|---|
| ArgC MSlow |
 |
|---|
| LysN MSlow |
 |
|---|
| TryLysC MSlow |
 |
|---|
| Try MShigh |
 |
|---|
| ChTry MShigh |
 |
|---|
| ArgC MShigh |
 |
|---|
| LysN MShigh |
 |
|---|
| TryLysC MShigh |
 |
|---|
General Statistics
Number of major isoforms |
Number of additional isoforms |
Number of all proteins |
Number of amino acids |
Min. Seq. Length |
Max. Seq. Length |
Avg. Seq. Length |
Avg. Mol. Weight |
|---|---|---|---|---|---|---|---|
0 |
514180 |
38 |
1774 |
323.0 |
36.1 |
Amino acid frequency
Ala |
Cys |
Asp |
Glu |
Phe |
Gly |
His |
Ile |
Lys |
Leu |
|---|---|---|---|---|---|---|---|---|---|
8.259 ± 0.079 | 0.654 ± 0.017 |
5.084 ± 0.057 | 4.425 ± 0.058 |
4.092 ± 0.043 | 6.106 ± 0.059 |
2.425 ± 0.026 | 7.19 ± 0.059 |
5.616 ± 0.065 | 10.496 ± 0.074 |
Met |
Asn |
Gln |
Pro |
Arg |
Ser |
Thr |
Val |
Trp |
Tyr |
|---|---|---|---|---|---|---|---|---|---|
2.351 ± 0.027 | 5.049 ± 0.065 |
3.981 ± 0.033 | 7.105 ± 0.091 |
3.82 ± 0.042 | 5.712 ± 0.049 |
6.282 ± 0.056 | 6.749 ± 0.039 |
1.066 ± 0.023 | 3.537 ± 0.036 |
Most of the basic statistics you can see at this page can be downloaded from this CSV file
Proteome-pI is available under Creative Commons Attribution-NoDerivs license, for more details see here
| Reference: Kozlowski LP. Proteome-pI 2.0: Proteome Isoelectric Point Database Update. Nucleic Acids Res. 2021, doi: 10.1093/nar/gkab944 | Contact: Lukasz P. Kozlowski |
