Brachybacterium sp. UMB0905
Taxonomy: cellular organisms; Bacteria; Terrabacteria group; Actinobacteria; Actinomycetia; Micrococcales; Dermabacteraceae; Brachybacterium; unclassified Brachybacterium
Average proteome isoelectric point is 6.03
Get precalculated fractions of proteins

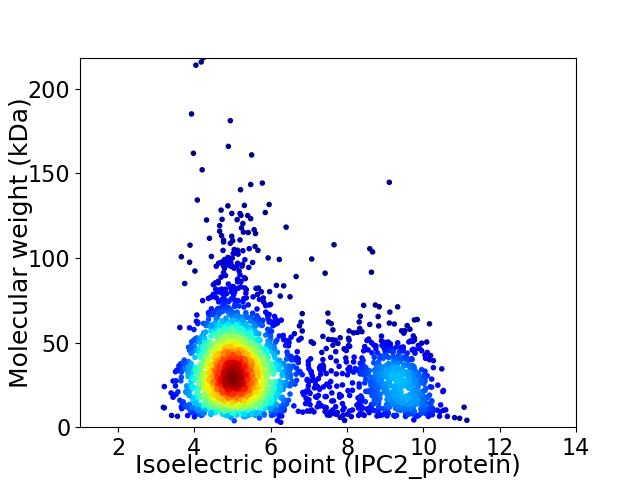
Virtual 2D-PAGE plot for 2790 proteins (isoelectric point calculated using IPC2_protein)
Get csv file with sequences according to given criteria:
* You can choose from 21 different methods for calculating isoelectric point
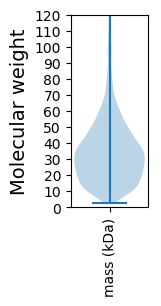
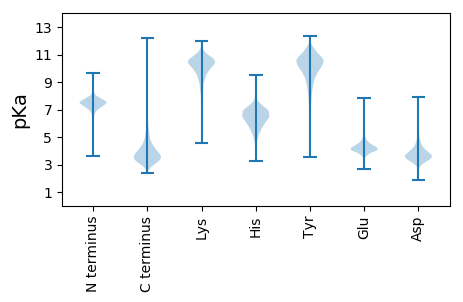
Summary statistics related to proteome-wise predictions


Protein with the lowest isoelectric point:
>tr|A0A2N6TZ05|A0A2N6TZ05_9MICO AAA family ATPase OS=Brachybacterium sp. UMB0905 OX=2069310 GN=CJ197_13115 PE=4 SV=1
MM1 pKa = 7.85DD2 pKa = 3.49TTDD5 pKa = 3.23PRR7 pKa = 11.84RR8 pKa = 11.84VGRR11 pKa = 11.84PYY13 pKa = 10.6PEE15 pKa = 4.44ARR17 pKa = 11.84EE18 pKa = 3.87HH19 pKa = 5.71TAAQNSAGAVPSGTAPRR36 pKa = 11.84NSFEE40 pKa = 3.97GRR42 pKa = 11.84PLHH45 pKa = 7.0HH46 pKa = 7.2PAEE49 pKa = 4.53DD50 pKa = 4.04VEE52 pKa = 4.38DD53 pKa = 3.46QGLAFDD59 pKa = 3.99VGTLVSRR66 pKa = 11.84RR67 pKa = 11.84GALGVLGAGSVTAVLAACTGGSASTTAAASDD98 pKa = 3.67GGGASDD104 pKa = 5.05AGGTTASEE112 pKa = 4.18LTEE115 pKa = 4.35MPGEE119 pKa = 4.21TAGPYY124 pKa = 10.16PGDD127 pKa = 3.75GSNGADD133 pKa = 3.27VLEE136 pKa = 4.38TSGVEE141 pKa = 3.72RR142 pKa = 11.84SDD144 pKa = 2.95IRR146 pKa = 11.84SSIDD150 pKa = 2.73GGTTVEE156 pKa = 5.05GVPLDD161 pKa = 3.31ITMTIIDD168 pKa = 4.1MAGGDD173 pKa = 3.9VPMEE177 pKa = 4.22GAAVYY182 pKa = 9.55LWQCDD187 pKa = 3.16AAGRR191 pKa = 11.84YY192 pKa = 9.26SMYY195 pKa = 10.69SEE197 pKa = 4.04GVEE200 pKa = 3.9EE201 pKa = 3.99EE202 pKa = 4.51TYY204 pKa = 11.11LRR206 pKa = 11.84GVQIADD212 pKa = 3.23AQGAVTFTSIFPGCYY227 pKa = 9.05AGRR230 pKa = 11.84WPHH233 pKa = 5.89LHH235 pKa = 6.73FEE237 pKa = 4.35VFPDD241 pKa = 3.5AEE243 pKa = 4.64SIVDD247 pKa = 3.61AGNAILTSQIAMPEE261 pKa = 3.85AEE263 pKa = 4.07ADD265 pKa = 3.58GVYY268 pKa = 10.77EE269 pKa = 4.0LTEE272 pKa = 4.07YY273 pKa = 10.93AGSAEE278 pKa = 4.23NLSQLTLEE286 pKa = 4.3TDD288 pKa = 3.51NVFSDD293 pKa = 4.99GYY295 pKa = 8.66EE296 pKa = 3.91QQLATLSGDD305 pKa = 3.57LDD307 pKa = 3.45SGYY310 pKa = 10.94AFTIDD315 pKa = 3.66VPIDD319 pKa = 3.37TTTEE323 pKa = 4.06PEE325 pKa = 3.96VGGMGGGEE333 pKa = 4.44GGPGGQPPADD343 pKa = 3.79GEE345 pKa = 4.36GGPDD349 pKa = 3.8GEE351 pKa = 5.21GGTPPEE357 pKa = 4.45GAPGEE362 pKa = 4.49GGEE365 pKa = 4.62PPADD369 pKa = 3.69APSDD373 pKa = 3.75GGGDD377 pKa = 3.67TQSS380 pKa = 3.0
MM1 pKa = 7.85DD2 pKa = 3.49TTDD5 pKa = 3.23PRR7 pKa = 11.84RR8 pKa = 11.84VGRR11 pKa = 11.84PYY13 pKa = 10.6PEE15 pKa = 4.44ARR17 pKa = 11.84EE18 pKa = 3.87HH19 pKa = 5.71TAAQNSAGAVPSGTAPRR36 pKa = 11.84NSFEE40 pKa = 3.97GRR42 pKa = 11.84PLHH45 pKa = 7.0HH46 pKa = 7.2PAEE49 pKa = 4.53DD50 pKa = 4.04VEE52 pKa = 4.38DD53 pKa = 3.46QGLAFDD59 pKa = 3.99VGTLVSRR66 pKa = 11.84RR67 pKa = 11.84GALGVLGAGSVTAVLAACTGGSASTTAAASDD98 pKa = 3.67GGGASDD104 pKa = 5.05AGGTTASEE112 pKa = 4.18LTEE115 pKa = 4.35MPGEE119 pKa = 4.21TAGPYY124 pKa = 10.16PGDD127 pKa = 3.75GSNGADD133 pKa = 3.27VLEE136 pKa = 4.38TSGVEE141 pKa = 3.72RR142 pKa = 11.84SDD144 pKa = 2.95IRR146 pKa = 11.84SSIDD150 pKa = 2.73GGTTVEE156 pKa = 5.05GVPLDD161 pKa = 3.31ITMTIIDD168 pKa = 4.1MAGGDD173 pKa = 3.9VPMEE177 pKa = 4.22GAAVYY182 pKa = 9.55LWQCDD187 pKa = 3.16AAGRR191 pKa = 11.84YY192 pKa = 9.26SMYY195 pKa = 10.69SEE197 pKa = 4.04GVEE200 pKa = 3.9EE201 pKa = 3.99EE202 pKa = 4.51TYY204 pKa = 11.11LRR206 pKa = 11.84GVQIADD212 pKa = 3.23AQGAVTFTSIFPGCYY227 pKa = 9.05AGRR230 pKa = 11.84WPHH233 pKa = 5.89LHH235 pKa = 6.73FEE237 pKa = 4.35VFPDD241 pKa = 3.5AEE243 pKa = 4.64SIVDD247 pKa = 3.61AGNAILTSQIAMPEE261 pKa = 3.85AEE263 pKa = 4.07ADD265 pKa = 3.58GVYY268 pKa = 10.77EE269 pKa = 4.0LTEE272 pKa = 4.07YY273 pKa = 10.93AGSAEE278 pKa = 4.23NLSQLTLEE286 pKa = 4.3TDD288 pKa = 3.51NVFSDD293 pKa = 4.99GYY295 pKa = 8.66EE296 pKa = 3.91QQLATLSGDD305 pKa = 3.57LDD307 pKa = 3.45SGYY310 pKa = 10.94AFTIDD315 pKa = 3.66VPIDD319 pKa = 3.37TTTEE323 pKa = 4.06PEE325 pKa = 3.96VGGMGGGEE333 pKa = 4.44GGPGGQPPADD343 pKa = 3.79GEE345 pKa = 4.36GGPDD349 pKa = 3.8GEE351 pKa = 5.21GGTPPEE357 pKa = 4.45GAPGEE362 pKa = 4.49GGEE365 pKa = 4.62PPADD369 pKa = 3.69APSDD373 pKa = 3.75GGGDD377 pKa = 3.67TQSS380 pKa = 3.0
Molecular weight: 38.25 kDa
Isoelectric point according different methods:
Protein with the highest isoelectric point:
>tr|A0A2N6U448|A0A2N6U448_9MICO Catalase OS=Brachybacterium sp. UMB0905 OX=2069310 GN=CJ197_04185 PE=3 SV=1
MM1 pKa = 7.28GSVVKK6 pKa = 10.44KK7 pKa = 9.48RR8 pKa = 11.84RR9 pKa = 11.84KK10 pKa = 9.32RR11 pKa = 11.84MSKK14 pKa = 9.76KK15 pKa = 9.54KK16 pKa = 9.79HH17 pKa = 5.67RR18 pKa = 11.84KK19 pKa = 8.31LLRR22 pKa = 11.84KK23 pKa = 7.78TRR25 pKa = 11.84HH26 pKa = 3.65QRR28 pKa = 11.84RR29 pKa = 11.84NKK31 pKa = 9.78KK32 pKa = 9.85
MM1 pKa = 7.28GSVVKK6 pKa = 10.44KK7 pKa = 9.48RR8 pKa = 11.84RR9 pKa = 11.84KK10 pKa = 9.32RR11 pKa = 11.84MSKK14 pKa = 9.76KK15 pKa = 9.54KK16 pKa = 9.79HH17 pKa = 5.67RR18 pKa = 11.84KK19 pKa = 8.31LLRR22 pKa = 11.84KK23 pKa = 7.78TRR25 pKa = 11.84HH26 pKa = 3.65QRR28 pKa = 11.84RR29 pKa = 11.84NKK31 pKa = 9.78KK32 pKa = 9.85
Molecular weight: 4.09 kDa
Isoelectric point according different methods:
Peptides (in silico digests for buttom-up proteomics)
Below you can find in silico digests of the whole proteome with Trypsin, Chymotrypsin, Trypsin+LysC, LysN, ArgC proteases suitable for different mass spec machines.| Try ESI |
 |
|---|
| ChTry ESI |
 |
|---|
| ArgC ESI |
 |
|---|
| LysN ESI |
 |
|---|
| TryLysC ESI |
 |
|---|
| Try MALDI |
 |
|---|
| ChTry MALDI |
 |
|---|
| ArgC MALDI |
 |
|---|
| LysN MALDI |
 |
|---|
| TryLysC MALDI |
 |
|---|
| Try LTQ |
 |
|---|
| ChTry LTQ |
 |
|---|
| ArgC LTQ |
 |
|---|
| LysN LTQ |
 |
|---|
| TryLysC LTQ |
 |
|---|
| Try MSlow |
 |
|---|
| ChTry MSlow |
 |
|---|
| ArgC MSlow |
 |
|---|
| LysN MSlow |
 |
|---|
| TryLysC MSlow |
 |
|---|
| Try MShigh |
 |
|---|
| ChTry MShigh |
 |
|---|
| ArgC MShigh |
 |
|---|
| LysN MShigh |
 |
|---|
| TryLysC MShigh |
 |
|---|
General Statistics
Number of major isoforms |
Number of additional isoforms |
Number of all proteins |
Number of amino acids |
Min. Seq. Length |
Max. Seq. Length |
Avg. Seq. Length |
Avg. Mol. Weight |
|---|---|---|---|---|---|---|---|
0 |
933859 |
24 |
2077 |
334.7 |
35.97 |
Amino acid frequency
Ala |
Cys |
Asp |
Glu |
Phe |
Gly |
His |
Ile |
Lys |
Leu |
|---|---|---|---|---|---|---|---|---|---|
12.965 ± 0.07 | 0.564 ± 0.01 |
6.14 ± 0.038 | 6.414 ± 0.047 |
2.657 ± 0.028 | 8.896 ± 0.044 |
2.263 ± 0.022 | 4.266 ± 0.036 |
1.812 ± 0.033 | 10.527 ± 0.059 |
Met |
Asn |
Gln |
Pro |
Arg |
Ser |
Thr |
Val |
Trp |
Tyr |
|---|---|---|---|---|---|---|---|---|---|
2.03 ± 0.017 | 1.694 ± 0.021 |
5.852 ± 0.037 | 3.384 ± 0.023 |
7.61 ± 0.055 | 5.337 ± 0.03 |
6.197 ± 0.032 | 8.151 ± 0.036 |
1.426 ± 0.02 | 1.816 ± 0.02 |
Most of the basic statistics you can see at this page can be downloaded from this CSV file
Proteome-pI is available under Creative Commons Attribution-NoDerivs license, for more details see here
| Reference: Kozlowski LP. Proteome-pI 2.0: Proteome Isoelectric Point Database Update. Nucleic Acids Res. 2021, doi: 10.1093/nar/gkab944 | Contact: Lukasz P. Kozlowski |
