Vibrio phage pre-CTX
Taxonomy: Viruses; Monodnaviria; Loebvirae; Hofneiviricota; Faserviricetes; Tubulavirales; Inoviridae; unclassified Inoviridae
Average proteome isoelectric point is 6.53
Get precalculated fractions of proteins
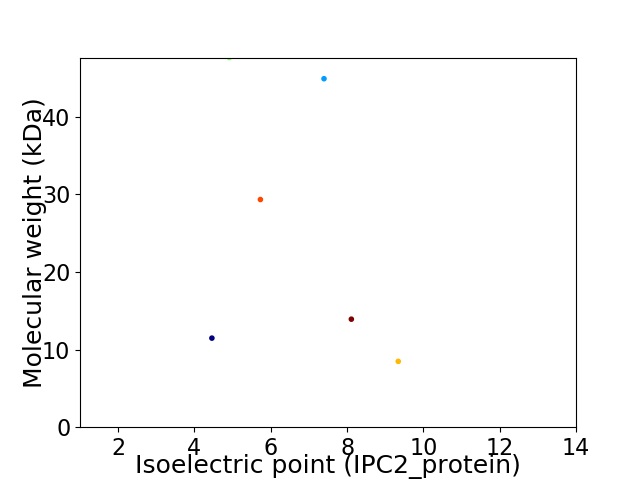
Virtual 2D-PAGE plot for 6 proteins (isoelectric point calculated using IPC2_protein)
Get csv file with sequences according to given criteria:
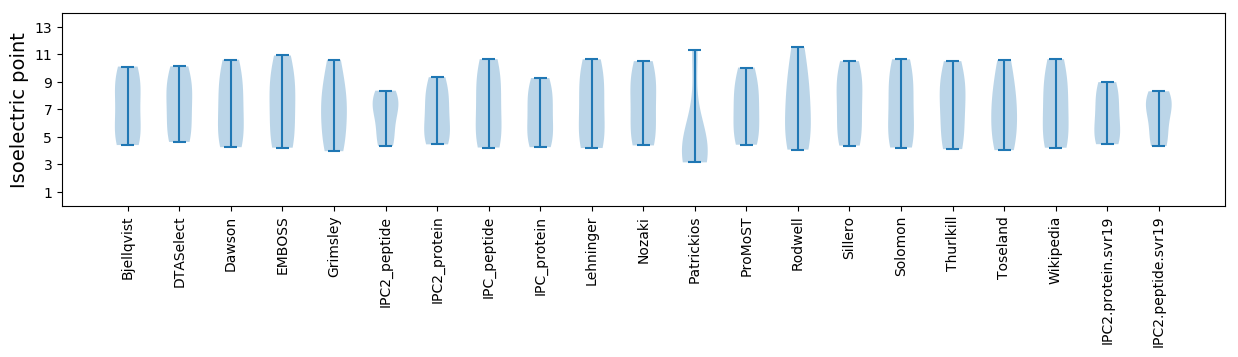
* You can choose from 21 different methods for calculating isoelectric point
Summary statistics related to proteome-wise predictions
Protein with the lowest isoelectric point:
>tr|A0A0N7F140|A0A0N7F140_9VIRU Core encoded pilin OS=Vibrio phage pre-CTX OX=689414 GN=cep PE=4 SV=1
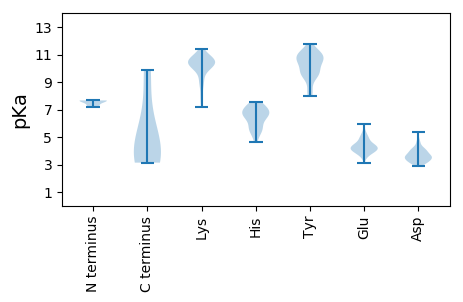
MM1 pKa = 7.31MLMMDD6 pKa = 4.7TLYY9 pKa = 11.2DD10 pKa = 3.44WLIDD14 pKa = 3.64GFTWLVIKK22 pKa = 10.51LGIMWIEE29 pKa = 3.84SKK31 pKa = 10.71IFVIQFFWEE40 pKa = 4.3MSQKK44 pKa = 10.43VIDD47 pKa = 4.21MFTIYY52 pKa = 10.39PLIQQAIDD60 pKa = 3.75MLPPQYY66 pKa = 10.95SGFLFFLGLDD76 pKa = 3.32QALAIVLQALMTRR89 pKa = 11.84FALRR93 pKa = 11.84ALNLL97 pKa = 3.56
MM1 pKa = 7.31MLMMDD6 pKa = 4.7TLYY9 pKa = 11.2DD10 pKa = 3.44WLIDD14 pKa = 3.64GFTWLVIKK22 pKa = 10.51LGIMWIEE29 pKa = 3.84SKK31 pKa = 10.71IFVIQFFWEE40 pKa = 4.3MSQKK44 pKa = 10.43VIDD47 pKa = 4.21MFTIYY52 pKa = 10.39PLIQQAIDD60 pKa = 3.75MLPPQYY66 pKa = 10.95SGFLFFLGLDD76 pKa = 3.32QALAIVLQALMTRR89 pKa = 11.84FALRR93 pKa = 11.84ALNLL97 pKa = 3.56
Molecular weight: 11.48 kDa
Isoelectric point according different methods:
Protein with the highest isoelectric point:
>tr|A0A142I6Y0|A0A142I6Y0_9VIRU Cholera toxin subunit A OS=Vibrio phage pre-CTX OX=689414 GN=ctxA PE=4 SV=1
MM1 pKa = 7.64FSSLKK6 pKa = 10.78NKK8 pKa = 10.41LNTFKK13 pKa = 10.35STLSLGVFLLFSAFANQALAAADD36 pKa = 3.71AGLVTEE42 pKa = 4.41VTKK45 pKa = 10.35TLGTSKK51 pKa = 10.11DD52 pKa = 3.48TVIALGPLIMGVVGAIVLIVTVIGLIRR79 pKa = 11.84KK80 pKa = 8.93AKK82 pKa = 9.89
MM1 pKa = 7.64FSSLKK6 pKa = 10.78NKK8 pKa = 10.41LNTFKK13 pKa = 10.35STLSLGVFLLFSAFANQALAAADD36 pKa = 3.71AGLVTEE42 pKa = 4.41VTKK45 pKa = 10.35TLGTSKK51 pKa = 10.11DD52 pKa = 3.48TVIALGPLIMGVVGAIVLIVTVIGLIRR79 pKa = 11.84KK80 pKa = 8.93AKK82 pKa = 9.89
Molecular weight: 8.48 kDa
Isoelectric point according different methods:
Peptides (in silico digests for buttom-up proteomics)
Below you can find in silico digests of the whole proteome with Trypsin, Chymotrypsin, Trypsin+LysC, LysN, ArgC proteases suitable for different mass spec machines.| Try ESI |
 |
|---|
| ChTry ESI |
|
|---|
| ArgC ESI |
|
|---|
| LysN ESI |
|
|---|
| TryLysC ESI |
|
|---|
| Try MALDI |
|
|---|
| ChTry MALDI |
|
|---|
| ArgC MALDI |
|
|---|
| LysN MALDI |
|
|---|
| TryLysC MALDI |
|
|---|
| Try LTQ |
|
|---|
| ChTry LTQ |
|
|---|
| ArgC LTQ |
|
|---|
| LysN LTQ |
|
|---|
| TryLysC LTQ |
|
|---|
| Try MSlow |
|
|---|
| ChTry MSlow |
|
|---|
| ArgC MSlow |
|
|---|
| LysN MSlow |
|
|---|
| TryLysC MSlow |
|
|---|
| Try MShigh |
|
|---|
| ChTry MShigh |
|
|---|
| ArgC MShigh |
|
|---|
| LysN MShigh |
|
|---|
| TryLysC MShigh |
|
|---|
General Statistics
Number of major isoforms |
Number of additional isoforms |
Number of all proteins |
Number of amino acids |
Min. Seq. Length |
Max. Seq. Length |
Avg. Seq. Length |
Avg. Mol. Weight |
|---|---|---|---|---|---|---|---|
0 |
1387 |
82 |
427 |
231.2 |
25.96 |
Amino acid frequency
Ala |
Cys |
Asp |
Glu |
Phe |
Gly |
His |
Ile |
Lys |
Leu |
|---|---|---|---|---|---|---|---|---|---|
7.354 ± 0.745 | 1.514 ± 0.519 |
5.624 ± 0.517 | 4.686 ± 0.594 |
5.84 ± 0.538 | 6.561 ± 0.595 |
2.884 ± 0.59 | 6.2 ± 0.823 |
4.686 ± 0.785 | 9.589 ± 1.109 |
Met |
Asn |
Gln |
Pro |
Arg |
Ser |
Thr |
Val |
Trp |
Tyr |
|---|---|---|---|---|---|---|---|---|---|
3.1 ± 0.629 | 4.254 ± 0.515 |
4.758 ± 0.537 | 3.605 ± 0.726 |
4.614 ± 0.555 | 7.714 ± 1.144 |
5.984 ± 0.822 | 5.84 ± 0.413 |
1.442 ± 0.366 | 3.749 ± 0.73 |
Most of the basic statistics you can see at this page can be downloaded from this CSV file
See this proteome in:

Proteome-pI is available under Creative Commons Attribution-NoDerivs license, for more details see here
| Reference: Kozlowski LP. Proteome-pI 2.0: Proteome Isoelectric Point Database Update. Nucleic Acids Res. 2021, doi: 10.1093/nar/gkab944 | Contact: Lukasz P. Kozlowski |