Mycobacterium phage Typha
Taxonomy: Viruses; Duplodnaviria; Heunggongvirae; Uroviricota; Caudoviricetes; Caudovirales; Siphoviridae; unclassified Siphoviridae
Average proteome isoelectric point is 6.23
Get precalculated fractions of proteins

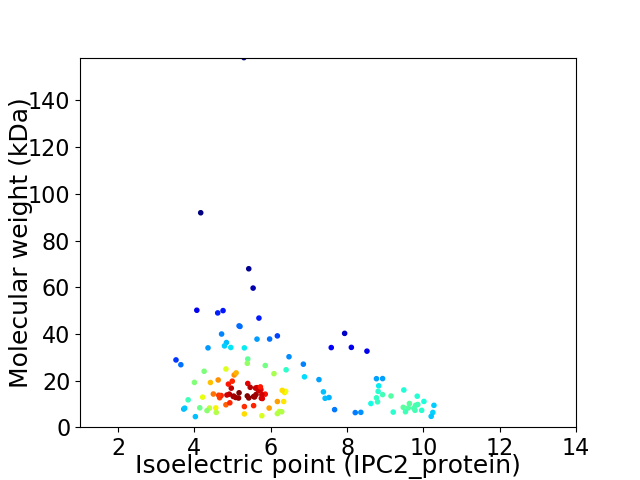
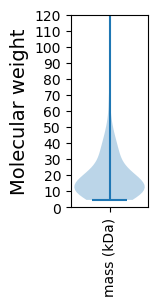
Virtual 2D-PAGE plot for 127 proteins (isoelectric point calculated using IPC2_protein)
Get csv file with sequences according to given criteria:
* You can choose from 21 different methods for calculating isoelectric point
Summary statistics related to proteome-wise predictions


Protein with the lowest isoelectric point:
>tr|A0A482JAP3|A0A482JAP3_9CAUD Uncharacterized protein OS=Mycobacterium phage Typha OX=2517971 GN=109 PE=4 SV=1
MM1 pKa = 7.97ADD3 pKa = 3.45FTVTGDD9 pKa = 3.15WTSILPGATLAADD22 pKa = 4.35LRR24 pKa = 11.84FQQMGNSADD33 pKa = 3.63VPGDD37 pKa = 3.24VHH39 pKa = 8.68ASIIDD44 pKa = 3.77GVLCDD49 pKa = 3.51ATGAEE54 pKa = 4.74DD55 pKa = 3.99VALTAPGAGATLFYY69 pKa = 10.05WVSINNLTVNGNAVTPRR86 pKa = 11.84RR87 pKa = 11.84FLIQAASANGEE98 pKa = 4.11VSLSALAPRR107 pKa = 11.84LFSMVEE113 pKa = 3.94GSTEE117 pKa = 3.93SGDD120 pKa = 3.85YY121 pKa = 9.83ATTDD125 pKa = 3.6YY126 pKa = 11.58VDD128 pKa = 3.36TAIANSGHH136 pKa = 6.51ATTADD141 pKa = 2.91IAAAVANLVSDD152 pKa = 4.18TDD154 pKa = 3.76LTAAIANFVTTSAMTTAIGNAVADD178 pKa = 4.12LVSSTEE184 pKa = 3.83LATALGDD191 pKa = 3.78YY192 pKa = 8.34VTADD196 pKa = 4.34DD197 pKa = 4.5LTSALSNRR205 pKa = 11.84PTTSAMNTAISNATSGLATTSDD227 pKa = 3.3VSNAVAGLASEE238 pKa = 4.74TYY240 pKa = 9.96VDD242 pKa = 3.71NAVLVPIVTGEE253 pKa = 4.1PTDD256 pKa = 3.87AAPDD260 pKa = 3.5GSMAIDD266 pKa = 3.4STGPTLYY273 pKa = 10.03MRR275 pKa = 11.84VEE277 pKa = 4.42GAWVAVTTAAA287 pKa = 4.52
MM1 pKa = 7.97ADD3 pKa = 3.45FTVTGDD9 pKa = 3.15WTSILPGATLAADD22 pKa = 4.35LRR24 pKa = 11.84FQQMGNSADD33 pKa = 3.63VPGDD37 pKa = 3.24VHH39 pKa = 8.68ASIIDD44 pKa = 3.77GVLCDD49 pKa = 3.51ATGAEE54 pKa = 4.74DD55 pKa = 3.99VALTAPGAGATLFYY69 pKa = 10.05WVSINNLTVNGNAVTPRR86 pKa = 11.84RR87 pKa = 11.84FLIQAASANGEE98 pKa = 4.11VSLSALAPRR107 pKa = 11.84LFSMVEE113 pKa = 3.94GSTEE117 pKa = 3.93SGDD120 pKa = 3.85YY121 pKa = 9.83ATTDD125 pKa = 3.6YY126 pKa = 11.58VDD128 pKa = 3.36TAIANSGHH136 pKa = 6.51ATTADD141 pKa = 2.91IAAAVANLVSDD152 pKa = 4.18TDD154 pKa = 3.76LTAAIANFVTTSAMTTAIGNAVADD178 pKa = 4.12LVSSTEE184 pKa = 3.83LATALGDD191 pKa = 3.78YY192 pKa = 8.34VTADD196 pKa = 4.34DD197 pKa = 4.5LTSALSNRR205 pKa = 11.84PTTSAMNTAISNATSGLATTSDD227 pKa = 3.3VSNAVAGLASEE238 pKa = 4.74TYY240 pKa = 9.96VDD242 pKa = 3.71NAVLVPIVTGEE253 pKa = 4.1PTDD256 pKa = 3.87AAPDD260 pKa = 3.5GSMAIDD266 pKa = 3.4STGPTLYY273 pKa = 10.03MRR275 pKa = 11.84VEE277 pKa = 4.42GAWVAVTTAAA287 pKa = 4.52
Molecular weight: 28.83 kDa
Isoelectric point according different methods:
Protein with the highest isoelectric point:
>tr|A0A482J6W6|A0A482J6W6_9CAUD Uncharacterized protein OS=Mycobacterium phage Typha OX=2517971 GN=102 PE=4 SV=1
MM1 pKa = 6.62TAKK4 pKa = 10.05GQHH7 pKa = 5.7RR8 pKa = 11.84SRR10 pKa = 11.84RR11 pKa = 11.84RR12 pKa = 11.84GWRR15 pKa = 11.84YY16 pKa = 9.78RR17 pKa = 11.84GVHH20 pKa = 4.38HH21 pKa = 6.38TRR23 pKa = 11.84RR24 pKa = 11.84GALTVADD31 pKa = 4.45IKK33 pKa = 11.38NSLRR37 pKa = 11.84PNDD40 pKa = 3.6GQMIHH45 pKa = 6.81LGSVIKK51 pKa = 10.83NVTFFGLPPDD61 pKa = 4.79ADD63 pKa = 3.48PSMVEE68 pKa = 3.71ATLTLVGDD76 pKa = 4.15EE77 pKa = 4.22PTLTIAALTGPPGPGAGSS95 pKa = 3.17
MM1 pKa = 6.62TAKK4 pKa = 10.05GQHH7 pKa = 5.7RR8 pKa = 11.84SRR10 pKa = 11.84RR11 pKa = 11.84RR12 pKa = 11.84GWRR15 pKa = 11.84YY16 pKa = 9.78RR17 pKa = 11.84GVHH20 pKa = 4.38HH21 pKa = 6.38TRR23 pKa = 11.84RR24 pKa = 11.84GALTVADD31 pKa = 4.45IKK33 pKa = 11.38NSLRR37 pKa = 11.84PNDD40 pKa = 3.6GQMIHH45 pKa = 6.81LGSVIKK51 pKa = 10.83NVTFFGLPPDD61 pKa = 4.79ADD63 pKa = 3.48PSMVEE68 pKa = 3.71ATLTLVGDD76 pKa = 4.15EE77 pKa = 4.22PTLTIAALTGPPGPGAGSS95 pKa = 3.17
Molecular weight: 10.15 kDa
Isoelectric point according different methods:
Peptides (in silico digests for buttom-up proteomics)
Below you can find in silico digests of the whole proteome with Trypsin, Chymotrypsin, Trypsin+LysC, LysN, ArgC proteases suitable for different mass spec machines.| Try ESI |
 |
|---|
| ChTry ESI |
 |
|---|
| ArgC ESI |
 |
|---|
| LysN ESI |
 |
|---|
| TryLysC ESI |
 |
|---|
| Try MALDI |
 |
|---|
| ChTry MALDI |
 |
|---|
| ArgC MALDI |
 |
|---|
| LysN MALDI |
 |
|---|
| TryLysC MALDI |
 |
|---|
| Try LTQ |
 |
|---|
| ChTry LTQ |
 |
|---|
| ArgC LTQ |
 |
|---|
| LysN LTQ |
 |
|---|
| TryLysC LTQ |
 |
|---|
| Try MSlow |
 |
|---|
| ChTry MSlow |
 |
|---|
| ArgC MSlow |
 |
|---|
| LysN MSlow |
 |
|---|
| TryLysC MSlow |
 |
|---|
| Try MShigh |
 |
|---|
| ChTry MShigh |
 |
|---|
| ArgC MShigh |
 |
|---|
| LysN MShigh |
 |
|---|
| TryLysC MShigh |
 |
|---|
General Statistics
Number of major isoforms |
Number of additional isoforms |
Number of all proteins |
Number of amino acids |
Min. Seq. Length |
Max. Seq. Length |
Avg. Seq. Length |
Avg. Mol. Weight |
|---|---|---|---|---|---|---|---|
0 |
23537 |
38 |
1527 |
185.3 |
20.27 |
Amino acid frequency
Ala |
Cys |
Asp |
Glu |
Phe |
Gly |
His |
Ile |
Lys |
Leu |
|---|---|---|---|---|---|---|---|---|---|
11.008 ± 0.333 | 1.177 ± 0.136 |
6.913 ± 0.214 | 5.782 ± 0.214 |
2.396 ± 0.117 | 8.701 ± 0.438 |
2.545 ± 0.176 | 3.811 ± 0.165 |
3.301 ± 0.186 | 7.758 ± 0.2 |
Met |
Asn |
Gln |
Pro |
Arg |
Ser |
Thr |
Val |
Trp |
Tyr |
|---|---|---|---|---|---|---|---|---|---|
2.541 ± 0.13 | 2.966 ± 0.154 |
5.961 ± 0.288 | 3.862 ± 0.151 |
6.891 ± 0.272 | 4.593 ± 0.181 |
7.053 ± 0.224 | 8.026 ± 0.22 |
2.226 ± 0.141 | 2.49 ± 0.142 |
Most of the basic statistics you can see at this page can be downloaded from this CSV file
Proteome-pI is available under Creative Commons Attribution-NoDerivs license, for more details see here
| Reference: Kozlowski LP. Proteome-pI 2.0: Proteome Isoelectric Point Database Update. Nucleic Acids Res. 2021, doi: 10.1093/nar/gkab944 | Contact: Lukasz P. Kozlowski |
