Echinacea purpurea witches -broom phytoplasma
Taxonomy: cellular organisms; Bacteria; Terrabacteria group; Tenericutes; Mollicutes; Acholeplasmatales; Acholeplasmataceae; Candidatus Phytoplasma; 16SrII (Peanut WB group)
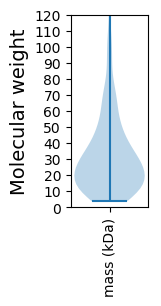
Average proteome isoelectric point is 8.06
Get precalculated fractions of proteins

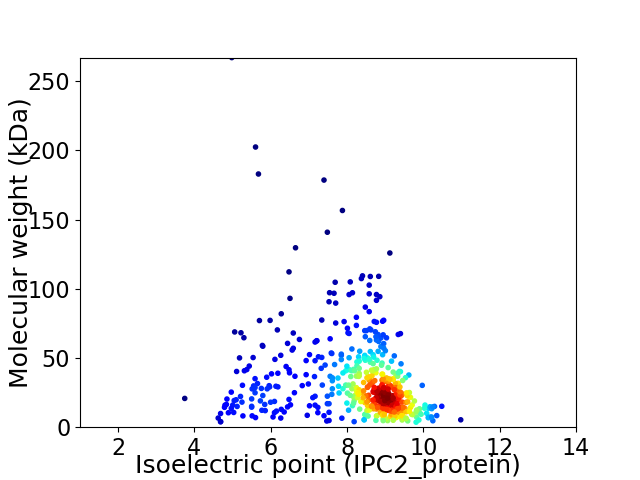
Virtual 2D-PAGE plot for 502 proteins (isoelectric point calculated using IPC2_protein)
Get csv file with sequences according to given criteria:
* You can choose from 21 different methods for calculating isoelectric point
Summary statistics related to proteome-wise predictions


Protein with the lowest isoelectric point:
>tr|A0A0P7HXU3|A0A0P7HXU3_9MOLU ABC-type spermidine/putrescine transport system periplasmic protein OS='Echinacea purpurea' witches'-broom phytoplasma OX=1123738 GN=potD PE=4 SV=1
MM1 pKa = 7.7INQSNNQNAFKK12 pKa = 9.64EE13 pKa = 4.13YY14 pKa = 11.17SMLEE18 pKa = 3.58IALDD22 pKa = 3.63ILQKK26 pKa = 10.57NPKK29 pKa = 8.84PMPVYY34 pKa = 10.46QLIEE38 pKa = 3.84QVLDD42 pKa = 3.23IKK44 pKa = 10.91KK45 pKa = 9.92IEE47 pKa = 4.35NLRR50 pKa = 11.84QDD52 pKa = 4.38CFLQLYY58 pKa = 9.77LDD60 pKa = 3.87IVISGLFVFHH70 pKa = 7.45GEE72 pKa = 4.17DD73 pKa = 2.89LWGIKK78 pKa = 8.72TDD80 pKa = 6.12NLDD83 pKa = 3.51LWDD86 pKa = 3.85KK87 pKa = 10.82EE88 pKa = 4.41YY89 pKa = 11.38YY90 pKa = 10.47ADD92 pKa = 4.59EE93 pKa = 4.5EE94 pKa = 4.77KK95 pKa = 11.07SDD97 pKa = 4.0IDD99 pKa = 5.53NEE101 pKa = 4.13LLDD104 pKa = 4.94LKK106 pKa = 11.03YY107 pKa = 11.19SNNLDD112 pKa = 3.36DD113 pKa = 6.49DD114 pKa = 4.28FRR116 pKa = 11.84LEE118 pKa = 3.88NDD120 pKa = 3.06SDD122 pKa = 4.13FSHH125 pKa = 7.04TDD127 pKa = 2.87EE128 pKa = 4.35TADD131 pKa = 4.61RR132 pKa = 11.84EE133 pKa = 4.19ILEE136 pKa = 5.6DD137 pKa = 3.58IDD139 pKa = 5.66DD140 pKa = 4.09VVLGDD145 pKa = 4.29DD146 pKa = 3.58EE147 pKa = 5.06AVLRR151 pKa = 11.84EE152 pKa = 4.1EE153 pKa = 4.25SDD155 pKa = 3.68SVNAEE160 pKa = 3.53EE161 pKa = 5.92DD162 pKa = 3.41KK163 pKa = 11.75NEE165 pKa = 5.62DD166 pKa = 3.1INEE169 pKa = 4.0YY170 pKa = 10.54DD171 pKa = 3.11WAPNEE176 pKa = 4.11EE177 pKa = 4.23
MM1 pKa = 7.7INQSNNQNAFKK12 pKa = 9.64EE13 pKa = 4.13YY14 pKa = 11.17SMLEE18 pKa = 3.58IALDD22 pKa = 3.63ILQKK26 pKa = 10.57NPKK29 pKa = 8.84PMPVYY34 pKa = 10.46QLIEE38 pKa = 3.84QVLDD42 pKa = 3.23IKK44 pKa = 10.91KK45 pKa = 9.92IEE47 pKa = 4.35NLRR50 pKa = 11.84QDD52 pKa = 4.38CFLQLYY58 pKa = 9.77LDD60 pKa = 3.87IVISGLFVFHH70 pKa = 7.45GEE72 pKa = 4.17DD73 pKa = 2.89LWGIKK78 pKa = 8.72TDD80 pKa = 6.12NLDD83 pKa = 3.51LWDD86 pKa = 3.85KK87 pKa = 10.82EE88 pKa = 4.41YY89 pKa = 11.38YY90 pKa = 10.47ADD92 pKa = 4.59EE93 pKa = 4.5EE94 pKa = 4.77KK95 pKa = 11.07SDD97 pKa = 4.0IDD99 pKa = 5.53NEE101 pKa = 4.13LLDD104 pKa = 4.94LKK106 pKa = 11.03YY107 pKa = 11.19SNNLDD112 pKa = 3.36DD113 pKa = 6.49DD114 pKa = 4.28FRR116 pKa = 11.84LEE118 pKa = 3.88NDD120 pKa = 3.06SDD122 pKa = 4.13FSHH125 pKa = 7.04TDD127 pKa = 2.87EE128 pKa = 4.35TADD131 pKa = 4.61RR132 pKa = 11.84EE133 pKa = 4.19ILEE136 pKa = 5.6DD137 pKa = 3.58IDD139 pKa = 5.66DD140 pKa = 4.09VVLGDD145 pKa = 4.29DD146 pKa = 3.58EE147 pKa = 5.06AVLRR151 pKa = 11.84EE152 pKa = 4.1EE153 pKa = 4.25SDD155 pKa = 3.68SVNAEE160 pKa = 3.53EE161 pKa = 5.92DD162 pKa = 3.41KK163 pKa = 11.75NEE165 pKa = 5.62DD166 pKa = 3.1INEE169 pKa = 4.0YY170 pKa = 10.54DD171 pKa = 3.11WAPNEE176 pKa = 4.11EE177 pKa = 4.23
Molecular weight: 20.79 kDa
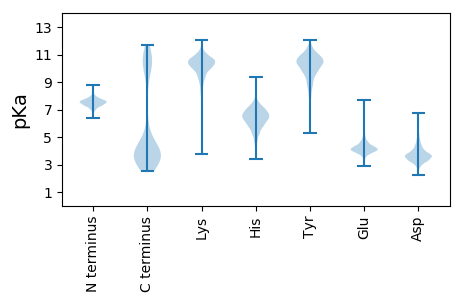
Isoelectric point according different methods:
Protein with the highest isoelectric point:
>tr|A0A0P7JJ83|A0A0P7JJ83_9MOLU Putative effector AYWB SAP68-like protein OS='Echinacea purpurea' witches'-broom phytoplasma OX=1123738 GN=EPWB_v1c4000 PE=4 SV=1
MM1 pKa = 7.35KK2 pKa = 9.43RR3 pKa = 11.84TYY5 pKa = 10.17QPSKK9 pKa = 9.44IKK11 pKa = 10.44RR12 pKa = 11.84KK13 pKa = 8.23RR14 pKa = 11.84THH16 pKa = 6.39GFLKK20 pKa = 10.52RR21 pKa = 11.84MSNASGRR28 pKa = 11.84RR29 pKa = 11.84LLSNRR34 pKa = 11.84RR35 pKa = 11.84YY36 pKa = 10.01KK37 pKa = 10.63GRR39 pKa = 11.84HH40 pKa = 4.12QLTVV44 pKa = 2.92
MM1 pKa = 7.35KK2 pKa = 9.43RR3 pKa = 11.84TYY5 pKa = 10.17QPSKK9 pKa = 9.44IKK11 pKa = 10.44RR12 pKa = 11.84KK13 pKa = 8.23RR14 pKa = 11.84THH16 pKa = 6.39GFLKK20 pKa = 10.52RR21 pKa = 11.84MSNASGRR28 pKa = 11.84RR29 pKa = 11.84LLSNRR34 pKa = 11.84RR35 pKa = 11.84YY36 pKa = 10.01KK37 pKa = 10.63GRR39 pKa = 11.84HH40 pKa = 4.12QLTVV44 pKa = 2.92
Molecular weight: 5.34 kDa
Isoelectric point according different methods:
Peptides (in silico digests for buttom-up proteomics)
Below you can find in silico digests of the whole proteome with Trypsin, Chymotrypsin, Trypsin+LysC, LysN, ArgC proteases suitable for different mass spec machines.| Try ESI |
 |
|---|
| ChTry ESI |
 |
|---|
| ArgC ESI |
 |
|---|
| LysN ESI |
 |
|---|
| TryLysC ESI |
 |
|---|
| Try MALDI |
 |
|---|
| ChTry MALDI |
 |
|---|
| ArgC MALDI |
 |
|---|
| LysN MALDI |
 |
|---|
| TryLysC MALDI |
 |
|---|
| Try LTQ |
 |
|---|
| ChTry LTQ |
 |
|---|
| ArgC LTQ |
 |
|---|
| LysN LTQ |
 |
|---|
| TryLysC LTQ |
 |
|---|
| Try MSlow |
 |
|---|
| ChTry MSlow |
 |
|---|
| ArgC MSlow |
 |
|---|
| LysN MSlow |
 |
|---|
| TryLysC MSlow |
 |
|---|
| Try MShigh |
 |
|---|
| ChTry MShigh |
 |
|---|
| ArgC MShigh |
 |
|---|
| LysN MShigh |
 |
|---|
| TryLysC MShigh |
 |
|---|
General Statistics
Number of major isoforms |
Number of additional isoforms |
Number of all proteins |
Number of amino acids |
Min. Seq. Length |
Max. Seq. Length |
Avg. Seq. Length |
Avg. Mol. Weight |
|---|---|---|---|---|---|---|---|
0 |
147945 |
31 |
2293 |
294.7 |
34.26 |
Amino acid frequency
Ala |
Cys |
Asp |
Glu |
Phe |
Gly |
His |
Ile |
Lys |
Leu |
|---|---|---|---|---|---|---|---|---|---|
3.765 ± 0.104 | 1.011 ± 0.037 |
4.822 ± 0.119 | 5.662 ± 0.137 |
5.777 ± 0.128 | 3.899 ± 0.119 |
1.887 ± 0.058 | 11.477 ± 0.116 |
10.392 ± 0.124 | 11.015 ± 0.111 |
Met |
Asn |
Gln |
Pro |
Arg |
Ser |
Thr |
Val |
Trp |
Tyr |
|---|---|---|---|---|---|---|---|---|---|
1.884 ± 0.038 | 8.396 ± 0.128 |
2.618 ± 0.065 | 4.764 ± 0.129 |
3.035 ± 0.067 | 6.011 ± 0.121 |
4.417 ± 0.153 | 4.261 ± 0.096 |
0.603 ± 0.029 | 4.304 ± 0.077 |
Most of the basic statistics you can see at this page can be downloaded from this CSV file
Proteome-pI is available under Creative Commons Attribution-NoDerivs license, for more details see here
| Reference: Kozlowski LP. Proteome-pI 2.0: Proteome Isoelectric Point Database Update. Nucleic Acids Res. 2021, doi: 10.1093/nar/gkab944 | Contact: Lukasz P. Kozlowski |
