Shigella phage Buco
Taxonomy: Viruses; Duplodnaviria; Heunggongvirae; Uroviricota; Caudoviricetes; Caudovirales; Autographiviridae; Slopekvirinae; Bucovirus; Shigella virus Buco
Average proteome isoelectric point is 6.45
Get precalculated fractions of proteins

Virtual 2D-PAGE plot for 53 proteins (isoelectric point calculated using IPC2_protein)
Get csv file with sequences according to given criteria:
* You can choose from 21 different methods for calculating isoelectric point
Summary statistics related to proteome-wise predictions


Protein with the lowest isoelectric point:
>tr|A0A482JMG8|A0A482JMG8_9CAUD Putative tail protein OS=Shigella phage Buco OX=2530183 GN=HRP29_gp44 PE=4 SV=1
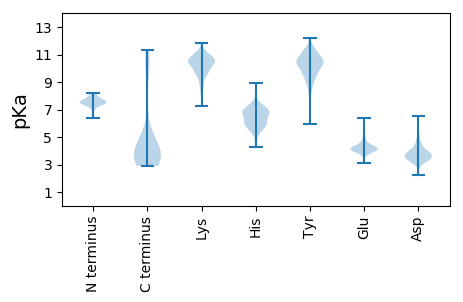
MM1 pKa = 7.65AYY3 pKa = 9.5SWSEE7 pKa = 3.64QVVPSGTTLISVDD20 pKa = 3.48IEE22 pKa = 4.32YY23 pKa = 10.75LDD25 pKa = 3.27KK26 pKa = 11.22SYY28 pKa = 10.84IYY30 pKa = 10.6LYY32 pKa = 10.15INNVLISNSDD42 pKa = 3.57YY43 pKa = 11.36SWNSDD48 pKa = 3.33TLIQLNTPMASAGTVLLVRR67 pKa = 11.84RR68 pKa = 11.84TDD70 pKa = 3.27KK71 pKa = 10.82EE72 pKa = 3.75YY73 pKa = 10.84LYY75 pKa = 10.82IMFAEE80 pKa = 5.24GAAFIRR86 pKa = 11.84EE87 pKa = 4.04NLDD90 pKa = 3.22VQNTQFLHH98 pKa = 6.45LAQEE102 pKa = 4.35LVEE105 pKa = 4.43GRR107 pKa = 11.84SIDD110 pKa = 3.6GFYY113 pKa = 11.32GDD115 pKa = 5.43LSMNGYY121 pKa = 10.3RR122 pKa = 11.84ITHH125 pKa = 6.94LADD128 pKa = 3.65GVDD131 pKa = 3.84PKK133 pKa = 11.29DD134 pKa = 3.7AVNKK138 pKa = 9.69GQLDD142 pKa = 3.9SVSNRR147 pKa = 11.84VSSIEE152 pKa = 3.79NSFLGLTTVSYY163 pKa = 9.48PWYY166 pKa = 8.45TVVSADD172 pKa = 3.38TDD174 pKa = 3.72TFEE177 pKa = 5.46PPFKK181 pKa = 9.57FTKK184 pKa = 9.81AALYY188 pKa = 9.99IDD190 pKa = 5.02GLCQVPDD197 pKa = 3.42YY198 pKa = 11.21SYY200 pKa = 11.77VVVDD204 pKa = 4.1NKK206 pKa = 10.96LLLAEE211 pKa = 4.44SVPTGTVVFARR222 pKa = 11.84LGEE225 pKa = 4.38DD226 pKa = 2.86TDD228 pKa = 4.09AATEE232 pKa = 4.08AATTTALAAVQADD245 pKa = 3.96LQNQINALRR254 pKa = 11.84ALLQGGG260 pKa = 3.68
MM1 pKa = 7.65AYY3 pKa = 9.5SWSEE7 pKa = 3.64QVVPSGTTLISVDD20 pKa = 3.48IEE22 pKa = 4.32YY23 pKa = 10.75LDD25 pKa = 3.27KK26 pKa = 11.22SYY28 pKa = 10.84IYY30 pKa = 10.6LYY32 pKa = 10.15INNVLISNSDD42 pKa = 3.57YY43 pKa = 11.36SWNSDD48 pKa = 3.33TLIQLNTPMASAGTVLLVRR67 pKa = 11.84RR68 pKa = 11.84TDD70 pKa = 3.27KK71 pKa = 10.82EE72 pKa = 3.75YY73 pKa = 10.84LYY75 pKa = 10.82IMFAEE80 pKa = 5.24GAAFIRR86 pKa = 11.84EE87 pKa = 4.04NLDD90 pKa = 3.22VQNTQFLHH98 pKa = 6.45LAQEE102 pKa = 4.35LVEE105 pKa = 4.43GRR107 pKa = 11.84SIDD110 pKa = 3.6GFYY113 pKa = 11.32GDD115 pKa = 5.43LSMNGYY121 pKa = 10.3RR122 pKa = 11.84ITHH125 pKa = 6.94LADD128 pKa = 3.65GVDD131 pKa = 3.84PKK133 pKa = 11.29DD134 pKa = 3.7AVNKK138 pKa = 9.69GQLDD142 pKa = 3.9SVSNRR147 pKa = 11.84VSSIEE152 pKa = 3.79NSFLGLTTVSYY163 pKa = 9.48PWYY166 pKa = 8.45TVVSADD172 pKa = 3.38TDD174 pKa = 3.72TFEE177 pKa = 5.46PPFKK181 pKa = 9.57FTKK184 pKa = 9.81AALYY188 pKa = 9.99IDD190 pKa = 5.02GLCQVPDD197 pKa = 3.42YY198 pKa = 11.21SYY200 pKa = 11.77VVVDD204 pKa = 4.1NKK206 pKa = 10.96LLLAEE211 pKa = 4.44SVPTGTVVFARR222 pKa = 11.84LGEE225 pKa = 4.38DD226 pKa = 2.86TDD228 pKa = 4.09AATEE232 pKa = 4.08AATTTALAAVQADD245 pKa = 3.96LQNQINALRR254 pKa = 11.84ALLQGGG260 pKa = 3.68
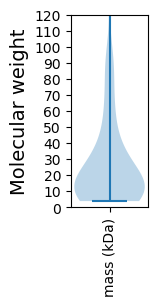
Molecular weight: 28.58 kDa
Isoelectric point according different methods:
Protein with the highest isoelectric point:
>tr|A0A482JKS3|A0A482JKS3_9CAUD DNA polymerase OS=Shigella phage Buco OX=2530183 GN=HRP29_gp19 PE=4 SV=1
MM1 pKa = 7.76ALTINPATVLEE12 pKa = 4.13RR13 pKa = 11.84QQRR16 pKa = 11.84SSIQGLARR24 pKa = 11.84EE25 pKa = 4.38YY26 pKa = 10.44SAKK29 pKa = 10.41AALRR33 pKa = 11.84TMYY36 pKa = 9.62EE37 pKa = 3.44QRR39 pKa = 11.84AAKK42 pKa = 10.3LGMTLAGYY50 pKa = 7.3CQRR53 pKa = 11.84FNIRR57 pKa = 11.84GVV59 pKa = 3.13
MM1 pKa = 7.76ALTINPATVLEE12 pKa = 4.13RR13 pKa = 11.84QQRR16 pKa = 11.84SSIQGLARR24 pKa = 11.84EE25 pKa = 4.38YY26 pKa = 10.44SAKK29 pKa = 10.41AALRR33 pKa = 11.84TMYY36 pKa = 9.62EE37 pKa = 3.44QRR39 pKa = 11.84AAKK42 pKa = 10.3LGMTLAGYY50 pKa = 7.3CQRR53 pKa = 11.84FNIRR57 pKa = 11.84GVV59 pKa = 3.13
Molecular weight: 6.6 kDa
Isoelectric point according different methods:
Peptides (in silico digests for buttom-up proteomics)
Below you can find in silico digests of the whole proteome with Trypsin, Chymotrypsin, Trypsin+LysC, LysN, ArgC proteases suitable for different mass spec machines.| Try ESI |
 |
|---|
| ChTry ESI |
 |
|---|
| ArgC ESI |
 |
|---|
| LysN ESI |
 |
|---|
| TryLysC ESI |
 |
|---|
| Try MALDI |
 |
|---|
| ChTry MALDI |
 |
|---|
| ArgC MALDI |
 |
|---|
| LysN MALDI |
 |
|---|
| TryLysC MALDI |
 |
|---|
| Try LTQ |
 |
|---|
| ChTry LTQ |
 |
|---|
| ArgC LTQ |
 |
|---|
| LysN LTQ |
 |
|---|
| TryLysC LTQ |
 |
|---|
| Try MSlow |
 |
|---|
| ChTry MSlow |
 |
|---|
| ArgC MSlow |
 |
|---|
| LysN MSlow |
 |
|---|
| TryLysC MSlow |
 |
|---|
| Try MShigh |
 |
|---|
| ChTry MShigh |
 |
|---|
| ArgC MShigh |
 |
|---|
| LysN MShigh |
 |
|---|
| TryLysC MShigh |
 |
|---|
General Statistics
Number of major isoforms |
Number of additional isoforms |
Number of all proteins |
Number of amino acids |
Min. Seq. Length |
Max. Seq. Length |
Avg. Seq. Length |
Avg. Mol. Weight |
|---|---|---|---|---|---|---|---|
0 |
13156 |
34 |
1279 |
248.2 |
27.4 |
Amino acid frequency
Ala |
Cys |
Asp |
Glu |
Phe |
Gly |
His |
Ile |
Lys |
Leu |
|---|---|---|---|---|---|---|---|---|---|
10.74 ± 0.579 | 1.026 ± 0.186 |
6.195 ± 0.196 | 5.822 ± 0.291 |
2.926 ± 0.147 | 7.631 ± 0.309 |
1.946 ± 0.203 | 4.576 ± 0.271 |
4.842 ± 0.281 | 8.916 ± 0.299 |
Met |
Asn |
Gln |
Pro |
Arg |
Ser |
Thr |
Val |
Trp |
Tyr |
|---|---|---|---|---|---|---|---|---|---|
2.919 ± 0.221 | 4.272 ± 0.287 |
3.907 ± 0.192 | 4.811 ± 0.267 |
5.701 ± 0.296 | 6.142 ± 0.283 |
5.549 ± 0.221 | 6.849 ± 0.22 |
1.414 ± 0.113 | 3.816 ± 0.199 |
Most of the basic statistics you can see at this page can be downloaded from this CSV file
Proteome-pI is available under Creative Commons Attribution-NoDerivs license, for more details see here
| Reference: Kozlowski LP. Proteome-pI 2.0: Proteome Isoelectric Point Database Update. Nucleic Acids Res. 2021, doi: 10.1093/nar/gkab944 | Contact: Lukasz P. Kozlowski |
