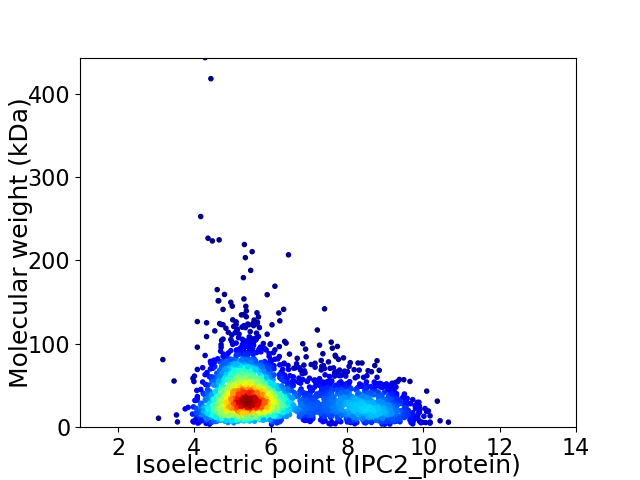
Treponema saccharophilum DSM 2985
Taxonomy: cellular organisms; Bacteria; Spirochaetes; Spirochaetia; Spirochaetales; Treponemataceae; Treponema; Treponema saccharophilum
Average proteome isoelectric point is 6.13
Get precalculated fractions of proteins

Virtual 2D-PAGE plot for 2828 proteins (isoelectric point calculated using IPC2_protein)
Get csv file with sequences according to given criteria:
* You can choose from 21 different methods for calculating isoelectric point
Summary statistics related to proteome-wise predictions


Protein with the lowest isoelectric point:
>tr|H7EM01|H7EM01_9SPIO CdiI_4 domain-containing protein OS=Treponema saccharophilum DSM 2985 OX=907348 GN=TresaDRAFT_1301 PE=4 SV=1
MM1 pKa = 7.36FEE3 pKa = 4.9KK4 pKa = 10.29FTGADD9 pKa = 3.3KK10 pKa = 11.39NFLNGFEE17 pKa = 3.9QLIGFEE23 pKa = 4.55LPADD27 pKa = 3.7YY28 pKa = 11.47SNFLLNTNGGTFKK41 pKa = 10.67EE42 pKa = 4.52LEE44 pKa = 4.09DD45 pKa = 4.26SFLLKK50 pKa = 10.92NIGEE54 pKa = 4.33QIFIDD59 pKa = 3.9CLFGFRR65 pKa = 11.84EE66 pKa = 4.06EE67 pKa = 4.98RR68 pKa = 11.84SLNLCNWYY76 pKa = 10.17KK77 pKa = 10.52EE78 pKa = 4.3YY79 pKa = 10.81EE80 pKa = 4.18LEE82 pKa = 4.59LPQNTIIIGNTYY94 pKa = 10.17GAGLIILIWDD104 pKa = 3.6EE105 pKa = 4.04NAKK108 pKa = 10.18GVYY111 pKa = 9.63LWDD114 pKa = 5.06DD115 pKa = 3.67SLEE118 pKa = 4.39LEE120 pKa = 4.49QSTEE124 pKa = 3.9EE125 pKa = 4.17CCTYY129 pKa = 10.78KK130 pKa = 9.42ITEE133 pKa = 4.17TFEE136 pKa = 5.67DD137 pKa = 5.13FMNLLNINN145 pKa = 3.67
MM1 pKa = 7.36FEE3 pKa = 4.9KK4 pKa = 10.29FTGADD9 pKa = 3.3KK10 pKa = 11.39NFLNGFEE17 pKa = 3.9QLIGFEE23 pKa = 4.55LPADD27 pKa = 3.7YY28 pKa = 11.47SNFLLNTNGGTFKK41 pKa = 10.67EE42 pKa = 4.52LEE44 pKa = 4.09DD45 pKa = 4.26SFLLKK50 pKa = 10.92NIGEE54 pKa = 4.33QIFIDD59 pKa = 3.9CLFGFRR65 pKa = 11.84EE66 pKa = 4.06EE67 pKa = 4.98RR68 pKa = 11.84SLNLCNWYY76 pKa = 10.17KK77 pKa = 10.52EE78 pKa = 4.3YY79 pKa = 10.81EE80 pKa = 4.18LEE82 pKa = 4.59LPQNTIIIGNTYY94 pKa = 10.17GAGLIILIWDD104 pKa = 3.6EE105 pKa = 4.04NAKK108 pKa = 10.18GVYY111 pKa = 9.63LWDD114 pKa = 5.06DD115 pKa = 3.67SLEE118 pKa = 4.39LEE120 pKa = 4.49QSTEE124 pKa = 3.9EE125 pKa = 4.17CCTYY129 pKa = 10.78KK130 pKa = 9.42ITEE133 pKa = 4.17TFEE136 pKa = 5.67DD137 pKa = 5.13FMNLLNINN145 pKa = 3.67
Molecular weight: 16.88 kDa
Isoelectric point according different methods:
Protein with the highest isoelectric point:
>tr|H7EI11|H7EI11_9SPIO Uncharacterized protein OS=Treponema saccharophilum DSM 2985 OX=907348 GN=TresaDRAFT_2567 PE=4 SV=1
MM1 pKa = 7.08EE2 pKa = 5.4QILILVGTSTLQTLAMVFFSTIFAVIIGFPLGILLNATAEE42 pKa = 4.23RR43 pKa = 11.84GITPHH48 pKa = 6.82PMLNMVLSRR57 pKa = 11.84VIDD60 pKa = 3.54VFRR63 pKa = 11.84SFPFVILMIVMLPFTRR79 pKa = 11.84LVLKK83 pKa = 9.13TVVGTAPTIIPLSFAAAPFIARR105 pKa = 11.84VTEE108 pKa = 4.07SALNEE113 pKa = 4.19VPEE116 pKa = 4.5GMVQAARR123 pKa = 11.84AMGSTNWQIIRR134 pKa = 11.84KK135 pKa = 8.79VLVPEE140 pKa = 4.61ALPSIVSGLTLTVINLVGCSAMAGTLGGGGLGDD173 pKa = 4.21LAIQYY178 pKa = 10.22GYY180 pKa = 11.2LRR182 pKa = 11.84FRR184 pKa = 11.84TDD186 pKa = 2.57VMIAAVVAIIIMVALIQFAGTSISNRR212 pKa = 11.84MMRR215 pKa = 11.84KK216 pKa = 8.97RR217 pKa = 3.41
MM1 pKa = 7.08EE2 pKa = 5.4QILILVGTSTLQTLAMVFFSTIFAVIIGFPLGILLNATAEE42 pKa = 4.23RR43 pKa = 11.84GITPHH48 pKa = 6.82PMLNMVLSRR57 pKa = 11.84VIDD60 pKa = 3.54VFRR63 pKa = 11.84SFPFVILMIVMLPFTRR79 pKa = 11.84LVLKK83 pKa = 9.13TVVGTAPTIIPLSFAAAPFIARR105 pKa = 11.84VTEE108 pKa = 4.07SALNEE113 pKa = 4.19VPEE116 pKa = 4.5GMVQAARR123 pKa = 11.84AMGSTNWQIIRR134 pKa = 11.84KK135 pKa = 8.79VLVPEE140 pKa = 4.61ALPSIVSGLTLTVINLVGCSAMAGTLGGGGLGDD173 pKa = 4.21LAIQYY178 pKa = 10.22GYY180 pKa = 11.2LRR182 pKa = 11.84FRR184 pKa = 11.84TDD186 pKa = 2.57VMIAAVVAIIIMVALIQFAGTSISNRR212 pKa = 11.84MMRR215 pKa = 11.84KK216 pKa = 8.97RR217 pKa = 3.41
Molecular weight: 23.27 kDa
Isoelectric point according different methods:
Peptides (in silico digests for buttom-up proteomics)
Below you can find in silico digests of the whole proteome with Trypsin, Chymotrypsin, Trypsin+LysC, LysN, ArgC proteases suitable for different mass spec machines.| Try ESI |
 |
|---|
| ChTry ESI |
 |
|---|
| ArgC ESI |
 |
|---|
| LysN ESI |
 |
|---|
| TryLysC ESI |
 |
|---|
| Try MALDI |
 |
|---|
| ChTry MALDI |
 |
|---|
| ArgC MALDI |
 |
|---|
| LysN MALDI |
 |
|---|
| TryLysC MALDI |
 |
|---|
| Try LTQ |
 |
|---|
| ChTry LTQ |
 |
|---|
| ArgC LTQ |
 |
|---|
| LysN LTQ |
 |
|---|
| TryLysC LTQ |
 |
|---|
| Try MSlow |
 |
|---|
| ChTry MSlow |
 |
|---|
| ArgC MSlow |
 |
|---|
| LysN MSlow |
 |
|---|
| TryLysC MSlow |
 |
|---|
| Try MShigh |
 |
|---|
| ChTry MShigh |
 |
|---|
| ArgC MShigh |
 |
|---|
| LysN MShigh |
 |
|---|
| TryLysC MShigh |
 |
|---|
General Statistics
Number of major isoforms |
Number of additional isoforms |
Number of all proteins |
Number of amino acids |
Min. Seq. Length |
Max. Seq. Length |
Avg. Seq. Length |
Avg. Mol. Weight |
|---|---|---|---|---|---|---|---|
0 |
1013328 |
31 |
4175 |
358.3 |
39.69 |
Amino acid frequency
Ala |
Cys |
Asp |
Glu |
Phe |
Gly |
His |
Ile |
Lys |
Leu |
|---|---|---|---|---|---|---|---|---|---|
8.529 ± 0.058 | 1.398 ± 0.021 |
5.967 ± 0.038 | 7.135 ± 0.048 |
5.049 ± 0.038 | 7.398 ± 0.049 |
1.396 ± 0.018 | 6.726 ± 0.037 |
6.721 ± 0.042 | 8.293 ± 0.045 |
Met |
Asn |
Gln |
Pro |
Arg |
Ser |
Thr |
Val |
Trp |
Tyr |
|---|---|---|---|---|---|---|---|---|---|
2.471 ± 0.023 | 4.244 ± 0.037 |
3.411 ± 0.027 | 2.485 ± 0.027 |
4.849 ± 0.047 | 7.719 ± 0.057 |
5.156 ± 0.051 | 6.876 ± 0.045 |
0.973 ± 0.016 | 3.205 ± 0.027 |
Most of the basic statistics you can see at this page can be downloaded from this CSV file
Proteome-pI is available under Creative Commons Attribution-NoDerivs license, for more details see here
| Reference: Kozlowski LP. Proteome-pI 2.0: Proteome Isoelectric Point Database Update. Nucleic Acids Res. 2021, doi: 10.1093/nar/gkab944 | Contact: Lukasz P. Kozlowski |
