Tigriopus californicus (Marine copepod)
Taxonomy: cellular organisms; Eukaryota; Opisthokonta; Metazoa; Eumetazoa; Bilateria; Protostomia; Ecdysozoa; Panarthropoda; Arthropoda; Mandibulata; Pancrustacea; Crustacea; Multicrustacea; Hexanauplia; Copepoda; Neocopepoda; Podoplea; Harpacticoida; Harpacticidae; Tigriopus
Average proteome isoelectric point is 6.49
Get precalculated fractions of proteins

Virtual 2D-PAGE plot for 15551 proteins (isoelectric point calculated using IPC2_protein)
Get csv file with sequences according to given criteria:
* You can choose from 21 different methods for calculating isoelectric point
Summary statistics related to proteome-wise predictions


Protein with the lowest isoelectric point:
>tr|A0A553PF11|A0A553PF11_TIGCA Uncharacterized protein OS=Tigriopus californicus OX=6832 GN=TCAL_14718 PE=4 SV=1
MM1 pKa = 7.48NNRR4 pKa = 11.84EE5 pKa = 4.22FILVKK10 pKa = 10.38ISLVLVLLIPPGEE23 pKa = 4.1LSPRR27 pKa = 11.84PLSVDD32 pKa = 3.68DD33 pKa = 3.85EE34 pKa = 4.63FSRR37 pKa = 11.84VDD39 pKa = 3.87FGPIARR45 pKa = 11.84NDD47 pKa = 3.52YY48 pKa = 10.86DD49 pKa = 3.84QGDD52 pKa = 3.98TGDD55 pKa = 3.71EE56 pKa = 4.2TLGGSNTAFGFADD69 pKa = 3.44HH70 pKa = 6.72QEE72 pKa = 4.08DD73 pKa = 4.41SFTSFGAPAASVSDD87 pKa = 4.01YY88 pKa = 11.59YY89 pKa = 11.61GDD91 pKa = 5.42DD92 pKa = 3.2EE93 pKa = 5.01DD94 pKa = 5.66KK95 pKa = 11.03RR96 pKa = 11.84VAGPAYY102 pKa = 10.38GGTAPNNYY110 pKa = 9.92DD111 pKa = 3.59YY112 pKa = 11.45GSEE115 pKa = 4.13GTDD118 pKa = 4.01GIGPQDD124 pKa = 3.47GGQYY128 pKa = 10.25QDD130 pKa = 4.25NLPHH134 pKa = 6.95PGVDD138 pKa = 3.17GQAYY142 pKa = 9.2PNYY145 pKa = 9.21EE146 pKa = 3.91DD147 pKa = 5.3DD148 pKa = 4.2YY149 pKa = 10.91LRR151 pKa = 11.84VGAPSPSDD159 pKa = 3.24PFDD162 pKa = 3.46FF163 pKa = 5.36
MM1 pKa = 7.48NNRR4 pKa = 11.84EE5 pKa = 4.22FILVKK10 pKa = 10.38ISLVLVLLIPPGEE23 pKa = 4.1LSPRR27 pKa = 11.84PLSVDD32 pKa = 3.68DD33 pKa = 3.85EE34 pKa = 4.63FSRR37 pKa = 11.84VDD39 pKa = 3.87FGPIARR45 pKa = 11.84NDD47 pKa = 3.52YY48 pKa = 10.86DD49 pKa = 3.84QGDD52 pKa = 3.98TGDD55 pKa = 3.71EE56 pKa = 4.2TLGGSNTAFGFADD69 pKa = 3.44HH70 pKa = 6.72QEE72 pKa = 4.08DD73 pKa = 4.41SFTSFGAPAASVSDD87 pKa = 4.01YY88 pKa = 11.59YY89 pKa = 11.61GDD91 pKa = 5.42DD92 pKa = 3.2EE93 pKa = 5.01DD94 pKa = 5.66KK95 pKa = 11.03RR96 pKa = 11.84VAGPAYY102 pKa = 10.38GGTAPNNYY110 pKa = 9.92DD111 pKa = 3.59YY112 pKa = 11.45GSEE115 pKa = 4.13GTDD118 pKa = 4.01GIGPQDD124 pKa = 3.47GGQYY128 pKa = 10.25QDD130 pKa = 4.25NLPHH134 pKa = 6.95PGVDD138 pKa = 3.17GQAYY142 pKa = 9.2PNYY145 pKa = 9.21EE146 pKa = 3.91DD147 pKa = 5.3DD148 pKa = 4.2YY149 pKa = 10.91LRR151 pKa = 11.84VGAPSPSDD159 pKa = 3.24PFDD162 pKa = 3.46FF163 pKa = 5.36
Molecular weight: 17.5 kDa
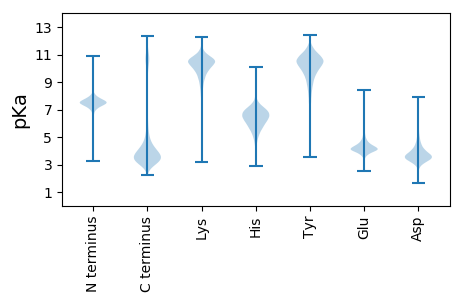
Isoelectric point according different methods:
Protein with the highest isoelectric point:
>tr|A0A553PSW2|A0A553PSW2_TIGCA Glycosyltransferase family 92 protein (Fragment) OS=Tigriopus californicus OX=6832 GN=TCAL_12012 PE=3 SV=1
MM1 pKa = 7.58LNLGISKK8 pKa = 10.05SPRR11 pKa = 11.84GIMSNAPLRR20 pKa = 11.84PRR22 pKa = 11.84SNIHH26 pKa = 6.09PNKK29 pKa = 9.46LTLKK33 pKa = 10.56LLIWLLWIVAWHH45 pKa = 5.59HH46 pKa = 4.96VNRR49 pKa = 11.84RR50 pKa = 11.84MSFFLNQTSLAPP62 pKa = 3.93
MM1 pKa = 7.58LNLGISKK8 pKa = 10.05SPRR11 pKa = 11.84GIMSNAPLRR20 pKa = 11.84PRR22 pKa = 11.84SNIHH26 pKa = 6.09PNKK29 pKa = 9.46LTLKK33 pKa = 10.56LLIWLLWIVAWHH45 pKa = 5.59HH46 pKa = 4.96VNRR49 pKa = 11.84RR50 pKa = 11.84MSFFLNQTSLAPP62 pKa = 3.93
Molecular weight: 7.2 kDa
Isoelectric point according different methods:
Peptides (in silico digests for buttom-up proteomics)
Below you can find in silico digests of the whole proteome with Trypsin, Chymotrypsin, Trypsin+LysC, LysN, ArgC proteases suitable for different mass spec machines.| Try ESI |
 |
|---|
| ChTry ESI |
 |
|---|
| ArgC ESI |
 |
|---|
| LysN ESI |
 |
|---|
| TryLysC ESI |
 |
|---|
| Try MALDI |
 |
|---|
| ChTry MALDI |
 |
|---|
| ArgC MALDI |
 |
|---|
| LysN MALDI |
 |
|---|
| TryLysC MALDI |
 |
|---|
| Try LTQ |
 |
|---|
| ChTry LTQ |
 |
|---|
| ArgC LTQ |
 |
|---|
| LysN LTQ |
 |
|---|
| TryLysC LTQ |
 |
|---|
| Try MSlow |
 |
|---|
| ChTry MSlow |
 |
|---|
| ArgC MSlow |
 |
|---|
| LysN MSlow |
 |
|---|
| TryLysC MSlow |
 |
|---|
| Try MShigh |
 |
|---|
| ChTry MShigh |
 |
|---|
| ArgC MShigh |
 |
|---|
| LysN MShigh |
 |
|---|
| TryLysC MShigh |
 |
|---|
General Statistics
Number of major isoforms |
Number of additional isoforms |
Number of all proteins |
Number of amino acids |
Min. Seq. Length |
Max. Seq. Length |
Avg. Seq. Length |
Avg. Mol. Weight |
|---|---|---|---|---|---|---|---|
0 |
8076027 |
22 |
9221 |
519.3 |
58.11 |
Amino acid frequency
Ala |
Cys |
Asp |
Glu |
Phe |
Gly |
His |
Ile |
Lys |
Leu |
|---|---|---|---|---|---|---|---|---|---|
6.258 ± 0.016 | 1.965 ± 0.019 |
5.644 ± 0.013 | 6.447 ± 0.024 |
4.114 ± 0.016 | 6.232 ± 0.022 |
2.723 ± 0.01 | 5.132 ± 0.016 |
5.78 ± 0.022 | 9.068 ± 0.027 |
Met |
Asn |
Gln |
Pro |
Arg |
Ser |
Thr |
Val |
Trp |
Tyr |
|---|---|---|---|---|---|---|---|---|---|
2.436 ± 0.009 | 4.605 ± 0.013 |
5.704 ± 0.027 | 4.455 ± 0.015 |
5.355 ± 0.016 | 8.699 ± 0.026 |
5.518 ± 0.014 | 5.988 ± 0.014 |
1.172 ± 0.007 | 2.701 ± 0.012 |
Most of the basic statistics you can see at this page can be downloaded from this CSV file
Proteome-pI is available under Creative Commons Attribution-NoDerivs license, for more details see here
| Reference: Kozlowski LP. Proteome-pI 2.0: Proteome Isoelectric Point Database Update. Nucleic Acids Res. 2021, doi: 10.1093/nar/gkab944 | Contact: Lukasz P. Kozlowski |
