Valsa mali var. pyri
Taxonomy: cellular organisms; Eukaryota; Opisthokonta; Fungi; Dikarya; Ascomycota; saccharomyceta; Pezizomycotina; leotiomyceta; sordariomyceta; Sordariomycetes; Sordariomycetidae; Diaporthales; Valsaceae; Valsa; Valsa mali
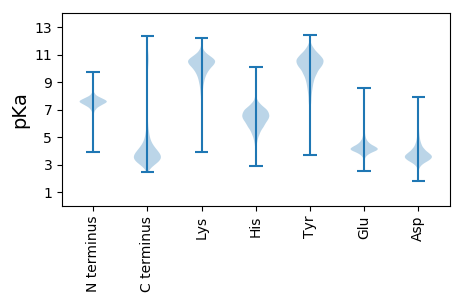
Average proteome isoelectric point is 6.26
Get precalculated fractions of proteins

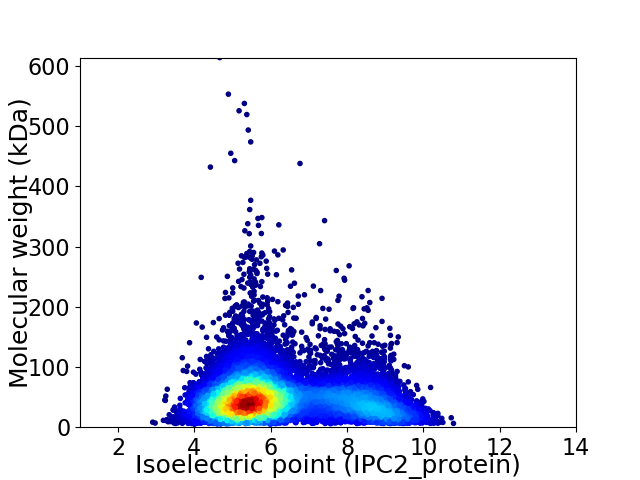
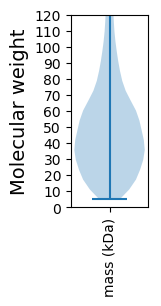
Virtual 2D-PAGE plot for 10741 proteins (isoelectric point calculated using IPC2_protein)
Get csv file with sequences according to given criteria:
* You can choose from 21 different methods for calculating isoelectric point
Summary statistics related to proteome-wise predictions


Protein with the lowest isoelectric point:
>tr|A0A194UQF3|A0A194UQF3_9PEZI Uncharacterized protein OS=Valsa mali var. pyri OX=694573 GN=VP1G_01238 PE=4 SV=1
MM1 pKa = 7.59HH2 pKa = 7.11FRR4 pKa = 11.84SPIWAAGTALLLASSATAQTSTSCNPTEE32 pKa = 4.45TTCDD36 pKa = 3.61PDD38 pKa = 3.39EE39 pKa = 4.53ALGMAIDD46 pKa = 3.62VDD48 pKa = 4.73FTQGEE53 pKa = 4.69VNSFTSSGGTPSYY66 pKa = 11.14GSDD69 pKa = 2.71GVTFTISKK77 pKa = 10.5EE78 pKa = 3.65GDD80 pKa = 3.15APQLNSIFYY89 pKa = 10.0IMFGKK94 pKa = 10.51VEE96 pKa = 4.09ITMKK100 pKa = 10.22CAPGTGIVTSVVLQSDD116 pKa = 4.11DD117 pKa = 3.97LDD119 pKa = 4.73EE120 pKa = 6.67IDD122 pKa = 5.02MEE124 pKa = 5.05FLGTDD129 pKa = 3.44DD130 pKa = 5.82SNVQLMYY137 pKa = 10.46FGKK140 pKa = 10.7GEE142 pKa = 3.97RR143 pKa = 11.84ADD145 pKa = 3.72NAVVNADD152 pKa = 3.9APNSQEE158 pKa = 4.86DD159 pKa = 4.28FVTYY163 pKa = 9.59TVDD166 pKa = 2.81WSSEE170 pKa = 3.95RR171 pKa = 11.84IAWSVAGTVVRR182 pKa = 11.84VLEE185 pKa = 4.29STTYY189 pKa = 10.02PDD191 pKa = 4.76YY192 pKa = 11.32YY193 pKa = 9.89PQTPMQLKK201 pKa = 9.38FGIWAGGDD209 pKa = 3.51PKK211 pKa = 11.01NSEE214 pKa = 4.35GTISWAGGTTDD225 pKa = 3.94YY226 pKa = 11.66SDD228 pKa = 4.4GPFSATVQRR237 pKa = 11.84VAVTDD242 pKa = 3.67YY243 pKa = 10.55STGSSYY249 pKa = 11.05TYY251 pKa = 11.11GNTSGLWEE259 pKa = 4.8SIEE262 pKa = 4.18SDD264 pKa = 3.04GGEE267 pKa = 3.86INANADD273 pKa = 3.27EE274 pKa = 4.62AATVTSVSGATSTGSSDD291 pKa = 3.72FPGSGIGDD299 pKa = 3.61GTSTVTASIEE309 pKa = 4.26SMPSGWHH316 pKa = 4.62MTSSGKK322 pKa = 9.67IVPNGSSAINPPHH335 pKa = 6.83ILLLAGPLSFFIFVVCNGGWRR356 pKa = 3.41
MM1 pKa = 7.59HH2 pKa = 7.11FRR4 pKa = 11.84SPIWAAGTALLLASSATAQTSTSCNPTEE32 pKa = 4.45TTCDD36 pKa = 3.61PDD38 pKa = 3.39EE39 pKa = 4.53ALGMAIDD46 pKa = 3.62VDD48 pKa = 4.73FTQGEE53 pKa = 4.69VNSFTSSGGTPSYY66 pKa = 11.14GSDD69 pKa = 2.71GVTFTISKK77 pKa = 10.5EE78 pKa = 3.65GDD80 pKa = 3.15APQLNSIFYY89 pKa = 10.0IMFGKK94 pKa = 10.51VEE96 pKa = 4.09ITMKK100 pKa = 10.22CAPGTGIVTSVVLQSDD116 pKa = 4.11DD117 pKa = 3.97LDD119 pKa = 4.73EE120 pKa = 6.67IDD122 pKa = 5.02MEE124 pKa = 5.05FLGTDD129 pKa = 3.44DD130 pKa = 5.82SNVQLMYY137 pKa = 10.46FGKK140 pKa = 10.7GEE142 pKa = 3.97RR143 pKa = 11.84ADD145 pKa = 3.72NAVVNADD152 pKa = 3.9APNSQEE158 pKa = 4.86DD159 pKa = 4.28FVTYY163 pKa = 9.59TVDD166 pKa = 2.81WSSEE170 pKa = 3.95RR171 pKa = 11.84IAWSVAGTVVRR182 pKa = 11.84VLEE185 pKa = 4.29STTYY189 pKa = 10.02PDD191 pKa = 4.76YY192 pKa = 11.32YY193 pKa = 9.89PQTPMQLKK201 pKa = 9.38FGIWAGGDD209 pKa = 3.51PKK211 pKa = 11.01NSEE214 pKa = 4.35GTISWAGGTTDD225 pKa = 3.94YY226 pKa = 11.66SDD228 pKa = 4.4GPFSATVQRR237 pKa = 11.84VAVTDD242 pKa = 3.67YY243 pKa = 10.55STGSSYY249 pKa = 11.05TYY251 pKa = 11.11GNTSGLWEE259 pKa = 4.8SIEE262 pKa = 4.18SDD264 pKa = 3.04GGEE267 pKa = 3.86INANADD273 pKa = 3.27EE274 pKa = 4.62AATVTSVSGATSTGSSDD291 pKa = 3.72FPGSGIGDD299 pKa = 3.61GTSTVTASIEE309 pKa = 4.26SMPSGWHH316 pKa = 4.62MTSSGKK322 pKa = 9.67IVPNGSSAINPPHH335 pKa = 6.83ILLLAGPLSFFIFVVCNGGWRR356 pKa = 3.41
Molecular weight: 37.33 kDa
Isoelectric point according different methods:
Protein with the highest isoelectric point:
>tr|A0A194ULZ4|A0A194ULZ4_9PEZI TPT domain-containing protein OS=Valsa mali var. pyri OX=694573 GN=VP1G_00193 PE=4 SV=1
MM1 pKa = 7.41SHH3 pKa = 6.25EE4 pKa = 4.71SVWNSRR10 pKa = 11.84PRR12 pKa = 11.84QYY14 pKa = 11.58GKK16 pKa = 10.29GARR19 pKa = 11.84EE20 pKa = 3.99CRR22 pKa = 11.84VCTHH26 pKa = 6.93RR27 pKa = 11.84AGLIRR32 pKa = 11.84KK33 pKa = 8.91YY34 pKa = 10.76GLNICRR40 pKa = 11.84QCFRR44 pKa = 11.84EE45 pKa = 4.01KK46 pKa = 10.63SADD49 pKa = 3.07IGFVKK54 pKa = 10.35HH55 pKa = 5.95RR56 pKa = 4.18
MM1 pKa = 7.41SHH3 pKa = 6.25EE4 pKa = 4.71SVWNSRR10 pKa = 11.84PRR12 pKa = 11.84QYY14 pKa = 11.58GKK16 pKa = 10.29GARR19 pKa = 11.84EE20 pKa = 3.99CRR22 pKa = 11.84VCTHH26 pKa = 6.93RR27 pKa = 11.84AGLIRR32 pKa = 11.84KK33 pKa = 8.91YY34 pKa = 10.76GLNICRR40 pKa = 11.84QCFRR44 pKa = 11.84EE45 pKa = 4.01KK46 pKa = 10.63SADD49 pKa = 3.07IGFVKK54 pKa = 10.35HH55 pKa = 5.95RR56 pKa = 4.18
Molecular weight: 6.59 kDa
Isoelectric point according different methods:
Peptides (in silico digests for buttom-up proteomics)
Below you can find in silico digests of the whole proteome with Trypsin, Chymotrypsin, Trypsin+LysC, LysN, ArgC proteases suitable for different mass spec machines.| Try ESI |
 |
|---|
| ChTry ESI |
 |
|---|
| ArgC ESI |
 |
|---|
| LysN ESI |
 |
|---|
| TryLysC ESI |
 |
|---|
| Try MALDI |
 |
|---|
| ChTry MALDI |
 |
|---|
| ArgC MALDI |
 |
|---|
| LysN MALDI |
 |
|---|
| TryLysC MALDI |
 |
|---|
| Try LTQ |
 |
|---|
| ChTry LTQ |
 |
|---|
| ArgC LTQ |
 |
|---|
| LysN LTQ |
 |
|---|
| TryLysC LTQ |
 |
|---|
| Try MSlow |
 |
|---|
| ChTry MSlow |
 |
|---|
| ArgC MSlow |
 |
|---|
| LysN MSlow |
 |
|---|
| TryLysC MSlow |
 |
|---|
| Try MShigh |
 |
|---|
| ChTry MShigh |
 |
|---|
| ArgC MShigh |
 |
|---|
| LysN MShigh |
 |
|---|
| TryLysC MShigh |
 |
|---|
General Statistics
Number of major isoforms |
Number of additional isoforms |
Number of all proteins |
Number of amino acids |
Min. Seq. Length |
Max. Seq. Length |
Avg. Seq. Length |
Avg. Mol. Weight |
|---|---|---|---|---|---|---|---|
0 |
5305359 |
50 |
5615 |
493.9 |
54.48 |
Amino acid frequency
Ala |
Cys |
Asp |
Glu |
Phe |
Gly |
His |
Ile |
Lys |
Leu |
|---|---|---|---|---|---|---|---|---|---|
8.799 ± 0.02 | 1.145 ± 0.007 |
5.928 ± 0.015 | 6.27 ± 0.026 |
3.593 ± 0.013 | 7.251 ± 0.023 |
2.334 ± 0.01 | 4.708 ± 0.015 |
4.83 ± 0.022 | 8.651 ± 0.027 |
Met |
Asn |
Gln |
Pro |
Arg |
Ser |
Thr |
Val |
Trp |
Tyr |
|---|---|---|---|---|---|---|---|---|---|
2.259 ± 0.009 | 3.636 ± 0.011 |
6.097 ± 0.026 | 3.954 ± 0.014 |
5.982 ± 0.021 | 8.048 ± 0.027 |
6.031 ± 0.021 | 6.281 ± 0.017 |
1.463 ± 0.008 | 2.739 ± 0.013 |
Most of the basic statistics you can see at this page can be downloaded from this CSV file
Proteome-pI is available under Creative Commons Attribution-NoDerivs license, for more details see here
| Reference: Kozlowski LP. Proteome-pI 2.0: Proteome Isoelectric Point Database Update. Nucleic Acids Res. 2021, doi: 10.1093/nar/gkab944 | Contact: Lukasz P. Kozlowski |
