Ranid herpesvirus 2
Taxonomy: Viruses; Duplodnaviria; Heunggongvirae; Peploviricota; Herviviricetes; Herpesvirales; Alloherpesviridae; Batrachovirus
Average proteome isoelectric point is 6.59
Get precalculated fractions of proteins

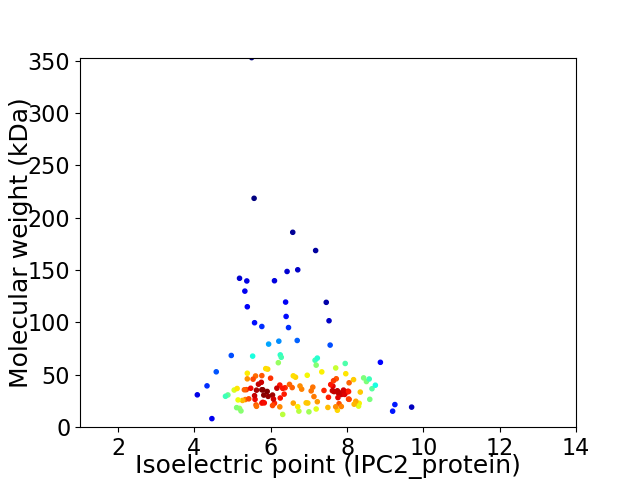
Virtual 2D-PAGE plot for 147 proteins (isoelectric point calculated using IPC2_protein)
Get csv file with sequences according to given criteria:
* You can choose from 21 different methods for calculating isoelectric point
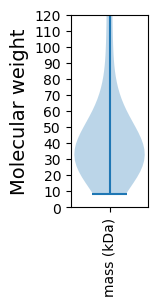
Summary statistics related to proteome-wise predictions


Protein with the lowest isoelectric point:
>tr|Q14W02|Q14W02_9VIRU ORF104 OS=Ranid herpesvirus 2 OX=389214 PE=4 SV=1
MM1 pKa = 7.09FVKK4 pKa = 9.61LTVVAIALACAVQRR18 pKa = 11.84HH19 pKa = 5.4AALVPSSNDD28 pKa = 3.02PEE30 pKa = 4.58KK31 pKa = 11.38YY32 pKa = 9.47IDD34 pKa = 3.64EE35 pKa = 5.1DD36 pKa = 4.94GYY38 pKa = 11.31GPTMLTKK45 pKa = 10.09FQIPQVPSFRR55 pKa = 11.84GTASPTEE62 pKa = 4.18DD63 pKa = 3.47EE64 pKa = 4.38EE65 pKa = 4.91EE66 pKa = 3.99EE67 pKa = 4.57VVVVEE72 pKa = 4.59RR73 pKa = 11.84VPPSAAAQEE82 pKa = 4.38EE83 pKa = 4.78EE84 pKa = 4.81TVAEE88 pKa = 4.35AATAEE93 pKa = 4.53TPTEE97 pKa = 4.33TVDD100 pKa = 3.46EE101 pKa = 4.95APTEE105 pKa = 4.12EE106 pKa = 4.49TPAEE110 pKa = 4.2AEE112 pKa = 4.14PTVLEE117 pKa = 4.43VPVDD121 pKa = 3.72TAEE124 pKa = 4.18TTTPAGVEE132 pKa = 4.2EE133 pKa = 4.31EE134 pKa = 5.03SITTTTPSPEE144 pKa = 3.97EE145 pKa = 4.06VEE147 pKa = 4.22RR148 pKa = 11.84TTLGVMLGLSILTTTGTTLSLVVEE172 pKa = 4.79EE173 pKa = 4.78PTNTTATPTTTTKK186 pKa = 10.78AVNTTPEE193 pKa = 4.23DD194 pKa = 3.79YY195 pKa = 10.62KK196 pKa = 11.51DD197 pKa = 3.59EE198 pKa = 5.42DD199 pKa = 3.75FDD201 pKa = 4.42EE202 pKa = 5.13YY203 pKa = 11.17EE204 pKa = 4.22SSDD207 pKa = 3.83TEE209 pKa = 4.02LHH211 pKa = 6.96DD212 pKa = 4.57RR213 pKa = 11.84LPTIGGYY220 pKa = 5.84TTPPRR225 pKa = 11.84STTASNTTVNGTSSKK240 pKa = 10.43PDD242 pKa = 3.24QKK244 pKa = 10.97PNQSNGSGPGSDD256 pKa = 3.19FGVYY260 pKa = 7.32VHH262 pKa = 6.96IFSKK266 pKa = 10.04ATAEE270 pKa = 5.51RR271 pKa = 11.84GPTWQAALLISVVFIMGVVFF291 pKa = 5.1
MM1 pKa = 7.09FVKK4 pKa = 9.61LTVVAIALACAVQRR18 pKa = 11.84HH19 pKa = 5.4AALVPSSNDD28 pKa = 3.02PEE30 pKa = 4.58KK31 pKa = 11.38YY32 pKa = 9.47IDD34 pKa = 3.64EE35 pKa = 5.1DD36 pKa = 4.94GYY38 pKa = 11.31GPTMLTKK45 pKa = 10.09FQIPQVPSFRR55 pKa = 11.84GTASPTEE62 pKa = 4.18DD63 pKa = 3.47EE64 pKa = 4.38EE65 pKa = 4.91EE66 pKa = 3.99EE67 pKa = 4.57VVVVEE72 pKa = 4.59RR73 pKa = 11.84VPPSAAAQEE82 pKa = 4.38EE83 pKa = 4.78EE84 pKa = 4.81TVAEE88 pKa = 4.35AATAEE93 pKa = 4.53TPTEE97 pKa = 4.33TVDD100 pKa = 3.46EE101 pKa = 4.95APTEE105 pKa = 4.12EE106 pKa = 4.49TPAEE110 pKa = 4.2AEE112 pKa = 4.14PTVLEE117 pKa = 4.43VPVDD121 pKa = 3.72TAEE124 pKa = 4.18TTTPAGVEE132 pKa = 4.2EE133 pKa = 4.31EE134 pKa = 5.03SITTTTPSPEE144 pKa = 3.97EE145 pKa = 4.06VEE147 pKa = 4.22RR148 pKa = 11.84TTLGVMLGLSILTTTGTTLSLVVEE172 pKa = 4.79EE173 pKa = 4.78PTNTTATPTTTTKK186 pKa = 10.78AVNTTPEE193 pKa = 4.23DD194 pKa = 3.79YY195 pKa = 10.62KK196 pKa = 11.51DD197 pKa = 3.59EE198 pKa = 5.42DD199 pKa = 3.75FDD201 pKa = 4.42EE202 pKa = 5.13YY203 pKa = 11.17EE204 pKa = 4.22SSDD207 pKa = 3.83TEE209 pKa = 4.02LHH211 pKa = 6.96DD212 pKa = 4.57RR213 pKa = 11.84LPTIGGYY220 pKa = 5.84TTPPRR225 pKa = 11.84STTASNTTVNGTSSKK240 pKa = 10.43PDD242 pKa = 3.24QKK244 pKa = 10.97PNQSNGSGPGSDD256 pKa = 3.19FGVYY260 pKa = 7.32VHH262 pKa = 6.96IFSKK266 pKa = 10.04ATAEE270 pKa = 5.51RR271 pKa = 11.84GPTWQAALLISVVFIMGVVFF291 pKa = 5.1
Molecular weight: 30.92 kDa
Isoelectric point according different methods:
Protein with the highest isoelectric point:
>tr|Q14VX4|Q14VX4_9VIRU ORF132 OS=Ranid herpesvirus 2 OX=389214 PE=4 SV=1
MM1 pKa = 7.61RR2 pKa = 11.84VLVLAAFLWAATGFNPRR19 pKa = 11.84VARR22 pKa = 11.84SADD25 pKa = 3.43FPLNDD30 pKa = 3.47QEE32 pKa = 4.22FARR35 pKa = 11.84VKK37 pKa = 10.55EE38 pKa = 3.83LLNRR42 pKa = 11.84NSVRR46 pKa = 11.84YY47 pKa = 9.51KK48 pKa = 10.17RR49 pKa = 11.84TDD51 pKa = 3.18GPPRR55 pKa = 11.84DD56 pKa = 3.73VDD58 pKa = 3.28ATFYY62 pKa = 10.91SVRR65 pKa = 11.84PPPAYY70 pKa = 8.7TAAFKK75 pKa = 10.53KK76 pKa = 10.12IYY78 pKa = 8.81TSRR81 pKa = 11.84SVRR84 pKa = 11.84SFCLRR89 pKa = 11.84DD90 pKa = 3.43YY91 pKa = 11.63VKK93 pKa = 10.98GKK95 pKa = 7.66TRR97 pKa = 11.84SVEE100 pKa = 3.71ASSCIFGLKK109 pKa = 9.63KK110 pKa = 10.33QLFLLRR116 pKa = 11.84STRR119 pKa = 11.84VQNITSEE126 pKa = 4.41PPCLEE131 pKa = 3.85VRR133 pKa = 11.84PVTSWGYY140 pKa = 10.53IYY142 pKa = 11.28VNALNQDD149 pKa = 3.74RR150 pKa = 11.84IKK152 pKa = 11.1INMGKK157 pKa = 9.29KK158 pKa = 9.55LQMMPCKK165 pKa = 10.0PRR167 pKa = 4.4
MM1 pKa = 7.61RR2 pKa = 11.84VLVLAAFLWAATGFNPRR19 pKa = 11.84VARR22 pKa = 11.84SADD25 pKa = 3.43FPLNDD30 pKa = 3.47QEE32 pKa = 4.22FARR35 pKa = 11.84VKK37 pKa = 10.55EE38 pKa = 3.83LLNRR42 pKa = 11.84NSVRR46 pKa = 11.84YY47 pKa = 9.51KK48 pKa = 10.17RR49 pKa = 11.84TDD51 pKa = 3.18GPPRR55 pKa = 11.84DD56 pKa = 3.73VDD58 pKa = 3.28ATFYY62 pKa = 10.91SVRR65 pKa = 11.84PPPAYY70 pKa = 8.7TAAFKK75 pKa = 10.53KK76 pKa = 10.12IYY78 pKa = 8.81TSRR81 pKa = 11.84SVRR84 pKa = 11.84SFCLRR89 pKa = 11.84DD90 pKa = 3.43YY91 pKa = 11.63VKK93 pKa = 10.98GKK95 pKa = 7.66TRR97 pKa = 11.84SVEE100 pKa = 3.71ASSCIFGLKK109 pKa = 9.63KK110 pKa = 10.33QLFLLRR116 pKa = 11.84STRR119 pKa = 11.84VQNITSEE126 pKa = 4.41PPCLEE131 pKa = 3.85VRR133 pKa = 11.84PVTSWGYY140 pKa = 10.53IYY142 pKa = 11.28VNALNQDD149 pKa = 3.74RR150 pKa = 11.84IKK152 pKa = 11.1INMGKK157 pKa = 9.29KK158 pKa = 9.55LQMMPCKK165 pKa = 10.0PRR167 pKa = 4.4
Molecular weight: 19.19 kDa
Isoelectric point according different methods:
Peptides (in silico digests for buttom-up proteomics)
Below you can find in silico digests of the whole proteome with Trypsin, Chymotrypsin, Trypsin+LysC, LysN, ArgC proteases suitable for different mass spec machines.| Try ESI |
 |
|---|
| ChTry ESI |
 |
|---|
| ArgC ESI |
 |
|---|
| LysN ESI |
 |
|---|
| TryLysC ESI |
 |
|---|
| Try MALDI |
 |
|---|
| ChTry MALDI |
 |
|---|
| ArgC MALDI |
 |
|---|
| LysN MALDI |
 |
|---|
| TryLysC MALDI |
 |
|---|
| Try LTQ |
 |
|---|
| ChTry LTQ |
 |
|---|
| ArgC LTQ |
 |
|---|
| LysN LTQ |
 |
|---|
| TryLysC LTQ |
 |
|---|
| Try MSlow |
 |
|---|
| ChTry MSlow |
 |
|---|
| ArgC MSlow |
 |
|---|
| LysN MSlow |
 |
|---|
| TryLysC MSlow |
 |
|---|
| Try MShigh |
 |
|---|
| ChTry MShigh |
 |
|---|
| ArgC MShigh |
 |
|---|
| LysN MShigh |
 |
|---|
| TryLysC MShigh |
 |
|---|
General Statistics
Number of major isoforms |
Number of additional isoforms |
Number of all proteins |
Number of amino acids |
Min. Seq. Length |
Max. Seq. Length |
Avg. Seq. Length |
Avg. Mol. Weight |
|---|---|---|---|---|---|---|---|
0 |
64480 |
75 |
3161 |
438.6 |
49.93 |
Amino acid frequency
Ala |
Cys |
Asp |
Glu |
Phe |
Gly |
His |
Ile |
Lys |
Leu |
|---|---|---|---|---|---|---|---|---|---|
7.368 ± 0.137 | 2.765 ± 0.095 |
4.994 ± 0.114 | 6.664 ± 0.191 |
3.916 ± 0.101 | 4.254 ± 0.125 |
3.015 ± 0.083 | 4.15 ± 0.086 |
5.538 ± 0.155 | 10.14 ± 0.18 |
Met |
Asn |
Gln |
Pro |
Arg |
Ser |
Thr |
Val |
Trp |
Tyr |
|---|---|---|---|---|---|---|---|---|---|
2.985 ± 0.09 | 4.045 ± 0.102 |
5.625 ± 0.275 | 3.725 ± 0.101 |
5.642 ± 0.112 | 6.368 ± 0.14 |
6.239 ± 0.131 | 6.914 ± 0.121 |
1.058 ± 0.049 | 4.595 ± 0.113 |
Most of the basic statistics you can see at this page can be downloaded from this CSV file
Proteome-pI is available under Creative Commons Attribution-NoDerivs license, for more details see here
| Reference: Kozlowski LP. Proteome-pI 2.0: Proteome Isoelectric Point Database Update. Nucleic Acids Res. 2021, doi: 10.1093/nar/gkab944 | Contact: Lukasz P. Kozlowski |
