Aurantiacibacter zhengii
Taxonomy: cellular organisms; Bacteria; Proteobacteria; Alphaproteobacteria; Sphingomonadales; Erythrobacteraceae; Aurantiacibacter
Average proteome isoelectric point is 5.86
Get precalculated fractions of proteins

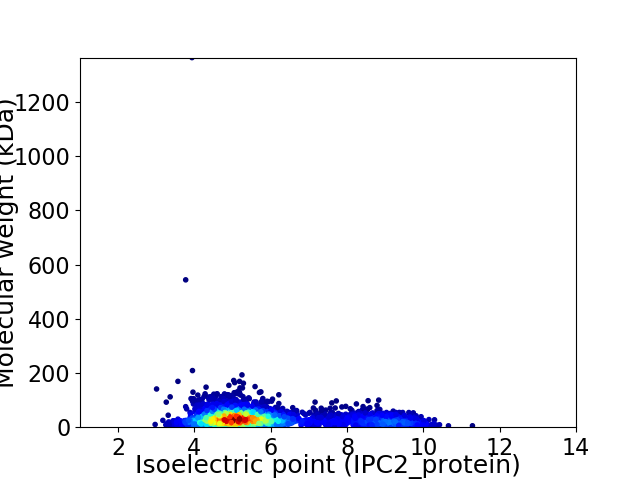
Virtual 2D-PAGE plot for 3511 proteins (isoelectric point calculated using IPC2_protein)
Get csv file with sequences according to given criteria:
* You can choose from 21 different methods for calculating isoelectric point
Summary statistics related to proteome-wise predictions


Protein with the lowest isoelectric point:
>tr|A0A418NS04|A0A418NS04_9SPHN YcgN family cysteine cluster protein OS=Aurantiacibacter zhengii OX=2307003 GN=D2V07_11150 PE=4 SV=1
MM1 pKa = 7.47SARR4 pKa = 11.84LSVVTPLLLALSLAACDD21 pKa = 4.38GGGSEE26 pKa = 5.25PPITDD31 pKa = 3.17APLYY35 pKa = 10.54NSALTGQYY43 pKa = 11.22DD44 pKa = 3.9LVDD47 pKa = 3.41SSGAQVTNADD57 pKa = 3.61FAGQYY62 pKa = 8.8QLVYY66 pKa = 10.15FGYY69 pKa = 10.26AYY71 pKa = 10.82CPDD74 pKa = 3.35ICPFDD79 pKa = 3.97MQRR82 pKa = 11.84MMRR85 pKa = 11.84GYY87 pKa = 11.14DD88 pKa = 3.06RR89 pKa = 11.84FAEE92 pKa = 4.4ANPDD96 pKa = 3.58LADD99 pKa = 3.91DD100 pKa = 3.94VQPIFITIDD109 pKa = 3.41PARR112 pKa = 11.84DD113 pKa = 3.35TPEE116 pKa = 3.93KK117 pKa = 10.35VGEE120 pKa = 4.06YY121 pKa = 11.02ANAFSDD127 pKa = 4.09RR128 pKa = 11.84LIGLTGSPEE137 pKa = 4.07QIEE140 pKa = 4.02AAAAAFFAHH149 pKa = 5.61YY150 pKa = 10.25QKK152 pKa = 10.99LDD154 pKa = 3.49PDD156 pKa = 4.16AEE158 pKa = 4.36SDD160 pKa = 3.75YY161 pKa = 11.71LMDD164 pKa = 4.43HH165 pKa = 6.42SRR167 pKa = 11.84TGYY170 pKa = 10.18LVDD173 pKa = 4.8RR174 pKa = 11.84EE175 pKa = 4.66GEE177 pKa = 4.11PMALIPVEE185 pKa = 4.72DD186 pKa = 3.76SAEE189 pKa = 3.9AVAAEE194 pKa = 4.13LEE196 pKa = 4.41KK197 pKa = 10.22WVRR200 pKa = 11.84PADD203 pKa = 3.62GG204 pKa = 3.71
MM1 pKa = 7.47SARR4 pKa = 11.84LSVVTPLLLALSLAACDD21 pKa = 4.38GGGSEE26 pKa = 5.25PPITDD31 pKa = 3.17APLYY35 pKa = 10.54NSALTGQYY43 pKa = 11.22DD44 pKa = 3.9LVDD47 pKa = 3.41SSGAQVTNADD57 pKa = 3.61FAGQYY62 pKa = 8.8QLVYY66 pKa = 10.15FGYY69 pKa = 10.26AYY71 pKa = 10.82CPDD74 pKa = 3.35ICPFDD79 pKa = 3.97MQRR82 pKa = 11.84MMRR85 pKa = 11.84GYY87 pKa = 11.14DD88 pKa = 3.06RR89 pKa = 11.84FAEE92 pKa = 4.4ANPDD96 pKa = 3.58LADD99 pKa = 3.91DD100 pKa = 3.94VQPIFITIDD109 pKa = 3.41PARR112 pKa = 11.84DD113 pKa = 3.35TPEE116 pKa = 3.93KK117 pKa = 10.35VGEE120 pKa = 4.06YY121 pKa = 11.02ANAFSDD127 pKa = 4.09RR128 pKa = 11.84LIGLTGSPEE137 pKa = 4.07QIEE140 pKa = 4.02AAAAAFFAHH149 pKa = 5.61YY150 pKa = 10.25QKK152 pKa = 10.99LDD154 pKa = 3.49PDD156 pKa = 4.16AEE158 pKa = 4.36SDD160 pKa = 3.75YY161 pKa = 11.71LMDD164 pKa = 4.43HH165 pKa = 6.42SRR167 pKa = 11.84TGYY170 pKa = 10.18LVDD173 pKa = 4.8RR174 pKa = 11.84EE175 pKa = 4.66GEE177 pKa = 4.11PMALIPVEE185 pKa = 4.72DD186 pKa = 3.76SAEE189 pKa = 3.9AVAAEE194 pKa = 4.13LEE196 pKa = 4.41KK197 pKa = 10.22WVRR200 pKa = 11.84PADD203 pKa = 3.62GG204 pKa = 3.71
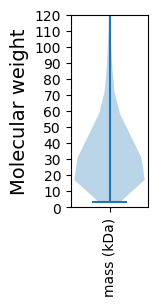
Molecular weight: 22.12 kDa
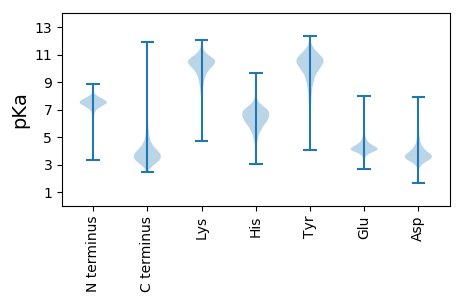
Isoelectric point according different methods:
Protein with the highest isoelectric point:
>tr|A0A418NRI3|A0A418NRI3_9SPHN Glutathione S-transferase family protein OS=Aurantiacibacter zhengii OX=2307003 GN=D2V07_09945 PE=4 SV=1
MM1 pKa = 7.45KK2 pKa = 9.61RR3 pKa = 11.84TFQPSNLVRR12 pKa = 11.84ARR14 pKa = 11.84RR15 pKa = 11.84HH16 pKa = 4.89GFFARR21 pKa = 11.84KK22 pKa = 8.02ATVGGRR28 pKa = 11.84KK29 pKa = 8.07VLRR32 pKa = 11.84NRR34 pKa = 11.84RR35 pKa = 11.84RR36 pKa = 11.84RR37 pKa = 11.84GRR39 pKa = 11.84KK40 pKa = 9.0KK41 pKa = 10.54LSAA44 pKa = 4.03
MM1 pKa = 7.45KK2 pKa = 9.61RR3 pKa = 11.84TFQPSNLVRR12 pKa = 11.84ARR14 pKa = 11.84RR15 pKa = 11.84HH16 pKa = 4.89GFFARR21 pKa = 11.84KK22 pKa = 8.02ATVGGRR28 pKa = 11.84KK29 pKa = 8.07VLRR32 pKa = 11.84NRR34 pKa = 11.84RR35 pKa = 11.84RR36 pKa = 11.84RR37 pKa = 11.84GRR39 pKa = 11.84KK40 pKa = 9.0KK41 pKa = 10.54LSAA44 pKa = 4.03
Molecular weight: 5.22 kDa
Isoelectric point according different methods:
Peptides (in silico digests for buttom-up proteomics)
Below you can find in silico digests of the whole proteome with Trypsin, Chymotrypsin, Trypsin+LysC, LysN, ArgC proteases suitable for different mass spec machines.| Try ESI |
 |
|---|
| ChTry ESI |
 |
|---|
| ArgC ESI |
 |
|---|
| LysN ESI |
 |
|---|
| TryLysC ESI |
 |
|---|
| Try MALDI |
 |
|---|
| ChTry MALDI |
 |
|---|
| ArgC MALDI |
 |
|---|
| LysN MALDI |
 |
|---|
| TryLysC MALDI |
 |
|---|
| Try LTQ |
 |
|---|
| ChTry LTQ |
 |
|---|
| ArgC LTQ |
 |
|---|
| LysN LTQ |
 |
|---|
| TryLysC LTQ |
 |
|---|
| Try MSlow |
 |
|---|
| ChTry MSlow |
 |
|---|
| ArgC MSlow |
 |
|---|
| LysN MSlow |
 |
|---|
| TryLysC MSlow |
 |
|---|
| Try MShigh |
 |
|---|
| ChTry MShigh |
 |
|---|
| ArgC MShigh |
 |
|---|
| LysN MShigh |
 |
|---|
| TryLysC MShigh |
 |
|---|
General Statistics
Number of major isoforms |
Number of additional isoforms |
Number of all proteins |
Number of amino acids |
Min. Seq. Length |
Max. Seq. Length |
Avg. Seq. Length |
Avg. Mol. Weight |
|---|---|---|---|---|---|---|---|
0 |
1132093 |
30 |
12886 |
322.4 |
35.01 |
Amino acid frequency
Ala |
Cys |
Asp |
Glu |
Phe |
Gly |
His |
Ile |
Lys |
Leu |
|---|---|---|---|---|---|---|---|---|---|
12.342 ± 0.068 | 0.833 ± 0.017 |
6.329 ± 0.046 | 6.422 ± 0.041 |
3.669 ± 0.027 | 8.834 ± 0.047 |
1.928 ± 0.026 | 4.914 ± 0.03 |
2.881 ± 0.035 | 9.692 ± 0.044 |
Met |
Asn |
Gln |
Pro |
Arg |
Ser |
Thr |
Val |
Trp |
Tyr |
|---|---|---|---|---|---|---|---|---|---|
2.543 ± 0.034 | 2.76 ± 0.03 |
5.063 ± 0.029 | 3.296 ± 0.02 |
6.936 ± 0.052 | 5.473 ± 0.038 |
5.252 ± 0.048 | 7.107 ± 0.037 |
1.459 ± 0.019 | 2.267 ± 0.024 |
Most of the basic statistics you can see at this page can be downloaded from this CSV file
Proteome-pI is available under Creative Commons Attribution-NoDerivs license, for more details see here
| Reference: Kozlowski LP. Proteome-pI 2.0: Proteome Isoelectric Point Database Update. Nucleic Acids Res. 2021, doi: 10.1093/nar/gkab944 | Contact: Lukasz P. Kozlowski |
