Parapedobacter composti
Taxonomy: cellular organisms; Bacteria; FCB group; Bacteroidetes/Chlorobi group; Bacteroidetes; Sphingobacteriia; Sphingobacteriales; Sphingobacteriaceae; Parapedobacter
Average proteome isoelectric point is 6.57
Get precalculated fractions of proteins
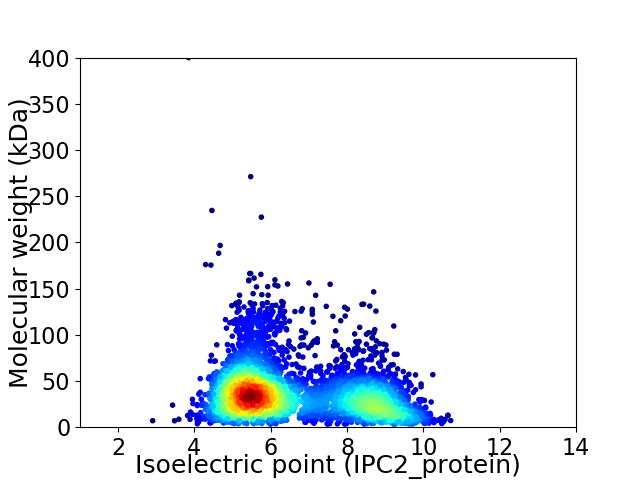
Virtual 2D-PAGE plot for 3985 proteins (isoelectric point calculated using IPC2_protein)
Get csv file with sequences according to given criteria:
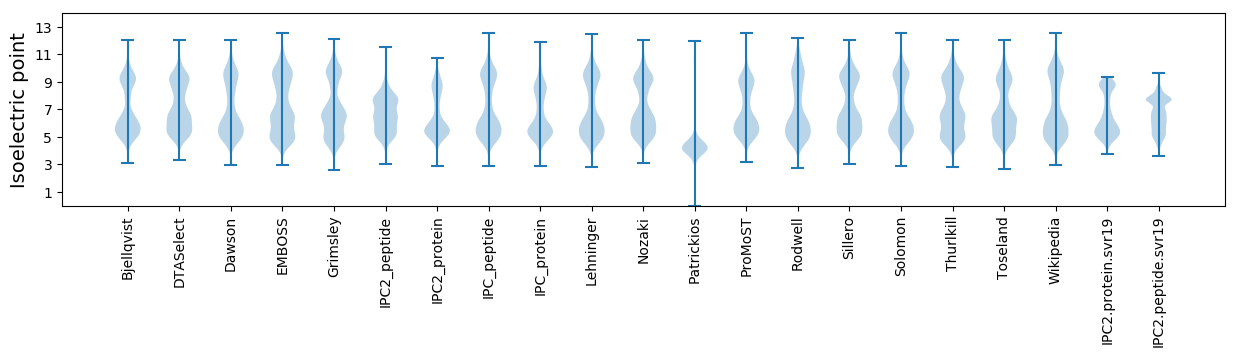
* You can choose from 21 different methods for calculating isoelectric point
Summary statistics related to proteome-wise predictions
Protein with the lowest isoelectric point:
>tr|A0A1I1M892|A0A1I1M892_9SPHI Uncharacterized protein OS=Parapedobacter composti OX=623281 GN=SAMN05421747_13015 PE=4 SV=1
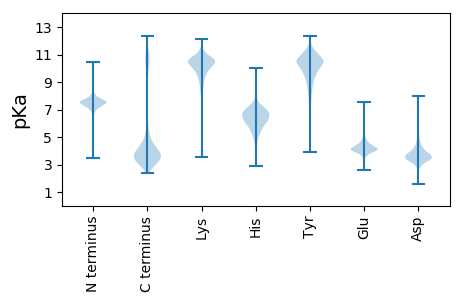
MM1 pKa = 7.51NFQSLLPIFPAIAVALLFTACEE23 pKa = 4.0KK24 pKa = 11.04VVDD27 pKa = 4.12IDD29 pKa = 5.37LDD31 pKa = 3.82TAEE34 pKa = 4.6PRR36 pKa = 11.84LVIDD40 pKa = 5.51AAISWEE46 pKa = 4.04KK47 pKa = 9.87GTDD50 pKa = 3.41GANQRR55 pKa = 11.84IRR57 pKa = 11.84LSTTTDD63 pKa = 3.32YY64 pKa = 11.35YY65 pKa = 10.79ATEE68 pKa = 4.22IPPVSGATVQISNAAGQRR86 pKa = 11.84FDD88 pKa = 4.53FVEE91 pKa = 4.14NPGTGEE97 pKa = 4.01YY98 pKa = 10.44LCTDD102 pKa = 4.58FVPEE106 pKa = 3.65LHH108 pKa = 6.4GVYY111 pKa = 9.98EE112 pKa = 4.14LRR114 pKa = 11.84VTVGDD119 pKa = 3.62QVYY122 pKa = 7.94TATEE126 pKa = 3.86TLMPVPEE133 pKa = 4.05ITRR136 pKa = 11.84IEE138 pKa = 4.07QRR140 pKa = 11.84VLDD143 pKa = 3.71IFGDD147 pKa = 3.83NIEE150 pKa = 3.94VRR152 pKa = 11.84FYY154 pKa = 11.39FNDD157 pKa = 3.91DD158 pKa = 3.19GTAEE162 pKa = 4.02NYY164 pKa = 10.39YY165 pKa = 9.27LTEE168 pKa = 3.96IQTDD172 pKa = 4.19FLLFPSYY179 pKa = 11.31GLLDD183 pKa = 3.62NQYY186 pKa = 8.09TQGNEE191 pKa = 3.6LFQPFIDD198 pKa = 4.33EE199 pKa = 4.41EE200 pKa = 4.52LDD202 pKa = 3.56SGGEE206 pKa = 3.67IQMRR210 pKa = 11.84LSGISRR216 pKa = 11.84QFYY219 pKa = 10.89SFMALILAATGGNPFSTPPANIRR242 pKa = 11.84GNIVNQTDD250 pKa = 3.37AGNVALGYY258 pKa = 10.25FRR260 pKa = 11.84LSEE263 pKa = 4.43TDD265 pKa = 2.89TVTYY269 pKa = 10.5VVEE272 pKa = 4.16
MM1 pKa = 7.51NFQSLLPIFPAIAVALLFTACEE23 pKa = 4.0KK24 pKa = 11.04VVDD27 pKa = 4.12IDD29 pKa = 5.37LDD31 pKa = 3.82TAEE34 pKa = 4.6PRR36 pKa = 11.84LVIDD40 pKa = 5.51AAISWEE46 pKa = 4.04KK47 pKa = 9.87GTDD50 pKa = 3.41GANQRR55 pKa = 11.84IRR57 pKa = 11.84LSTTTDD63 pKa = 3.32YY64 pKa = 11.35YY65 pKa = 10.79ATEE68 pKa = 4.22IPPVSGATVQISNAAGQRR86 pKa = 11.84FDD88 pKa = 4.53FVEE91 pKa = 4.14NPGTGEE97 pKa = 4.01YY98 pKa = 10.44LCTDD102 pKa = 4.58FVPEE106 pKa = 3.65LHH108 pKa = 6.4GVYY111 pKa = 9.98EE112 pKa = 4.14LRR114 pKa = 11.84VTVGDD119 pKa = 3.62QVYY122 pKa = 7.94TATEE126 pKa = 3.86TLMPVPEE133 pKa = 4.05ITRR136 pKa = 11.84IEE138 pKa = 4.07QRR140 pKa = 11.84VLDD143 pKa = 3.71IFGDD147 pKa = 3.83NIEE150 pKa = 3.94VRR152 pKa = 11.84FYY154 pKa = 11.39FNDD157 pKa = 3.91DD158 pKa = 3.19GTAEE162 pKa = 4.02NYY164 pKa = 10.39YY165 pKa = 9.27LTEE168 pKa = 3.96IQTDD172 pKa = 4.19FLLFPSYY179 pKa = 11.31GLLDD183 pKa = 3.62NQYY186 pKa = 8.09TQGNEE191 pKa = 3.6LFQPFIDD198 pKa = 4.33EE199 pKa = 4.41EE200 pKa = 4.52LDD202 pKa = 3.56SGGEE206 pKa = 3.67IQMRR210 pKa = 11.84LSGISRR216 pKa = 11.84QFYY219 pKa = 10.89SFMALILAATGGNPFSTPPANIRR242 pKa = 11.84GNIVNQTDD250 pKa = 3.37AGNVALGYY258 pKa = 10.25FRR260 pKa = 11.84LSEE263 pKa = 4.43TDD265 pKa = 2.89TVTYY269 pKa = 10.5VVEE272 pKa = 4.16
Molecular weight: 30.2 kDa
Isoelectric point according different methods:
Protein with the highest isoelectric point:
>tr|A0A1I1LVM5|A0A1I1LVM5_9SPHI Uncharacterized protein OS=Parapedobacter composti OX=623281 GN=SAMN05421747_12422 PE=4 SV=1
MM1 pKa = 7.49ILKK4 pKa = 9.26GCPKK8 pKa = 10.18GSPIVKK14 pKa = 10.12FEE16 pKa = 4.25IANCAYY22 pKa = 9.72PLSKK26 pKa = 10.5RR27 pKa = 11.84FNLSSNSAMYY37 pKa = 9.09FRR39 pKa = 11.84CRR41 pKa = 11.84DD42 pKa = 3.35IISPFLLTSGTRR54 pKa = 11.84PDD56 pKa = 3.6TYY58 pKa = 10.92KK59 pKa = 10.84SRR61 pKa = 11.84SSWAALTVLSRR72 pKa = 11.84FRR74 pKa = 11.84YY75 pKa = 8.91LGRR78 pKa = 11.84IFRR81 pKa = 4.47
MM1 pKa = 7.49ILKK4 pKa = 9.26GCPKK8 pKa = 10.18GSPIVKK14 pKa = 10.12FEE16 pKa = 4.25IANCAYY22 pKa = 9.72PLSKK26 pKa = 10.5RR27 pKa = 11.84FNLSSNSAMYY37 pKa = 9.09FRR39 pKa = 11.84CRR41 pKa = 11.84DD42 pKa = 3.35IISPFLLTSGTRR54 pKa = 11.84PDD56 pKa = 3.6TYY58 pKa = 10.92KK59 pKa = 10.84SRR61 pKa = 11.84SSWAALTVLSRR72 pKa = 11.84FRR74 pKa = 11.84YY75 pKa = 8.91LGRR78 pKa = 11.84IFRR81 pKa = 4.47
Molecular weight: 9.27 kDa
Isoelectric point according different methods:
Peptides (in silico digests for buttom-up proteomics)
Below you can find in silico digests of the whole proteome with Trypsin, Chymotrypsin, Trypsin+LysC, LysN, ArgC proteases suitable for different mass spec machines.| Try ESI |
 |
|---|
| ChTry ESI |
|
|---|
| ArgC ESI |
|
|---|
| LysN ESI |
|
|---|
| TryLysC ESI |
|
|---|
| Try MALDI |
|
|---|
| ChTry MALDI |
|
|---|
| ArgC MALDI |
|
|---|
| LysN MALDI |
|
|---|
| TryLysC MALDI |
|
|---|
| Try LTQ |
|
|---|
| ChTry LTQ |
|
|---|
| ArgC LTQ |
|
|---|
| LysN LTQ |
|
|---|
| TryLysC LTQ |
|
|---|
| Try MSlow |
|
|---|
| ChTry MSlow |
|
|---|
| ArgC MSlow |
|
|---|
| LysN MSlow |
|
|---|
| TryLysC MSlow |
|
|---|
| Try MShigh |
|
|---|
| ChTry MShigh |
|
|---|
| ArgC MShigh |
|
|---|
| LysN MShigh |
|
|---|
| TryLysC MShigh |
|
|---|
General Statistics
Number of major isoforms |
Number of additional isoforms |
Number of all proteins |
Number of amino acids |
Min. Seq. Length |
Max. Seq. Length |
Avg. Seq. Length |
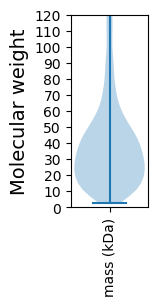
Avg. Mol. Weight |
|---|---|---|---|---|---|---|---|
0 |
1421768 |
24 |
3900 |
356.8 |
39.93 |
Amino acid frequency
Ala |
Cys |
Asp |
Glu |
Phe |
Gly |
His |
Ile |
Lys |
Leu |
|---|---|---|---|---|---|---|---|---|---|
8.472 ± 0.041 | 0.745 ± 0.01 |
5.577 ± 0.025 | 5.843 ± 0.036 |
4.57 ± 0.024 | 7.535 ± 0.035 |
2.2 ± 0.022 | 6.233 ± 0.037 |
4.965 ± 0.043 | 9.418 ± 0.039 |
Met |
Asn |
Gln |
Pro |
Arg |
Ser |
Thr |
Val |
Trp |
Tyr |
|---|---|---|---|---|---|---|---|---|---|
2.277 ± 0.019 | 4.745 ± 0.032 |
4.22 ± 0.023 | 3.794 ± 0.022 |
5.62 ± 0.029 | 5.76 ± 0.027 |
5.643 ± 0.036 | 6.855 ± 0.033 |
1.353 ± 0.018 | 4.175 ± 0.028 |
Most of the basic statistics you can see at this page can be downloaded from this CSV file
See this proteome in:

Proteome-pI is available under Creative Commons Attribution-NoDerivs license, for more details see here
| Reference: Kozlowski LP. Proteome-pI 2.0: Proteome Isoelectric Point Database Update. Nucleic Acids Res. 2021, doi: 10.1093/nar/gkab944 | Contact: Lukasz P. Kozlowski |