Yersinia phage phiR1-37
Taxonomy: Viruses; Duplodnaviria; Heunggongvirae; Uroviricota; Caudoviricetes; Caudovirales; Myoviridae; unclassified Myoviridae
Average proteome isoelectric point is 6.79
Get precalculated fractions of proteins

Virtual 2D-PAGE plot for 367 proteins (isoelectric point calculated using IPC2_protein)
Get csv file with sequences according to given criteria:
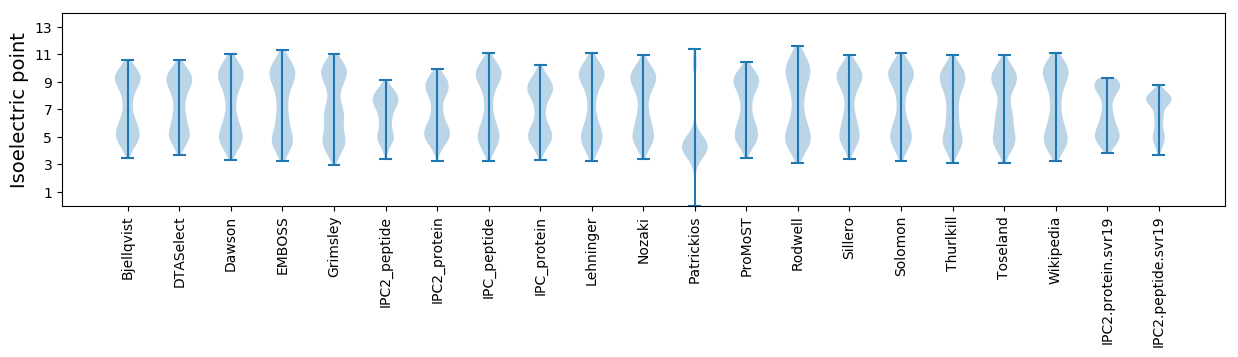
* You can choose from 21 different methods for calculating isoelectric point
Summary statistics related to proteome-wise predictions
Protein with the lowest isoelectric point:
>tr|G4KKM5|G4KKM5_9CAUD Homing endonuclease family OS=Yersinia phage phiR1-37 OX=331278 GN=g287 PE=4 SV=1
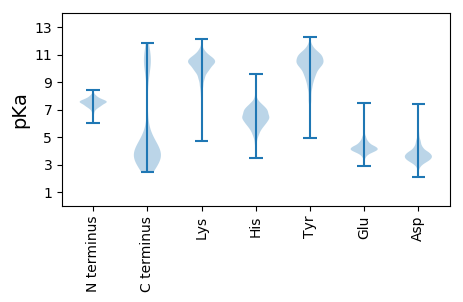
MM1 pKa = 7.46IVPIIIHH8 pKa = 6.15PNEE11 pKa = 4.25TNDD14 pKa = 3.43SFGVSVPGLKK24 pKa = 10.46GCFSAGDD31 pKa = 3.8TLEE34 pKa = 4.55EE35 pKa = 3.94ATQNVAEE42 pKa = 4.49ALDD45 pKa = 4.55LYY47 pKa = 11.16VEE49 pKa = 4.6HH50 pKa = 6.77CHH52 pKa = 6.3EE53 pKa = 4.62EE54 pKa = 4.24EE55 pKa = 4.59INVNGNGKK63 pKa = 9.99VMINTNIEE71 pKa = 3.92HH72 pKa = 7.3AFDD75 pKa = 3.5QSEE78 pKa = 4.19GGIVVCIMYY87 pKa = 10.46EE88 pKa = 3.76NDD90 pKa = 3.53DD91 pKa = 4.03AVSVDD96 pKa = 3.12ISS98 pKa = 3.31
MM1 pKa = 7.46IVPIIIHH8 pKa = 6.15PNEE11 pKa = 4.25TNDD14 pKa = 3.43SFGVSVPGLKK24 pKa = 10.46GCFSAGDD31 pKa = 3.8TLEE34 pKa = 4.55EE35 pKa = 3.94ATQNVAEE42 pKa = 4.49ALDD45 pKa = 4.55LYY47 pKa = 11.16VEE49 pKa = 4.6HH50 pKa = 6.77CHH52 pKa = 6.3EE53 pKa = 4.62EE54 pKa = 4.24EE55 pKa = 4.59INVNGNGKK63 pKa = 9.99VMINTNIEE71 pKa = 3.92HH72 pKa = 7.3AFDD75 pKa = 3.5QSEE78 pKa = 4.19GGIVVCIMYY87 pKa = 10.46EE88 pKa = 3.76NDD90 pKa = 3.53DD91 pKa = 4.03AVSVDD96 pKa = 3.12ISS98 pKa = 3.31
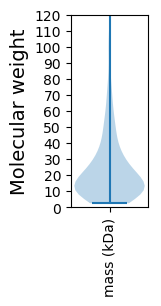
Molecular weight: 10.58 kDa
Isoelectric point according different methods:
Protein with the highest isoelectric point:
>tr|G4KKA1|G4KKA1_9CAUD G162 protein OS=Yersinia phage phiR1-37 OX=331278 GN=g162 PE=4 SV=1
MM1 pKa = 7.55VEE3 pKa = 4.09TNTYY7 pKa = 8.18TVHH10 pKa = 5.07STRR13 pKa = 11.84LKK15 pKa = 10.56RR16 pKa = 11.84IVNPILRR23 pKa = 11.84KK24 pKa = 8.83IQYY27 pKa = 7.7RR28 pKa = 11.84TNTPYY33 pKa = 10.93VIASEE38 pKa = 4.28FDD40 pKa = 3.16SSKK43 pKa = 9.79NTFIRR48 pKa = 11.84YY49 pKa = 8.61AIRR52 pKa = 11.84RR53 pKa = 11.84VGYY56 pKa = 9.93DD57 pKa = 3.15RR58 pKa = 11.84NVDD61 pKa = 3.75PDD63 pKa = 3.72KK64 pKa = 10.91STCIYY69 pKa = 10.51LKK71 pKa = 9.13TGKK74 pKa = 9.94EE75 pKa = 3.38IRR77 pKa = 11.84ITIKK81 pKa = 10.56YY82 pKa = 8.98YY83 pKa = 9.72IRR85 pKa = 11.84KK86 pKa = 8.93LFKK89 pKa = 10.62
MM1 pKa = 7.55VEE3 pKa = 4.09TNTYY7 pKa = 8.18TVHH10 pKa = 5.07STRR13 pKa = 11.84LKK15 pKa = 10.56RR16 pKa = 11.84IVNPILRR23 pKa = 11.84KK24 pKa = 8.83IQYY27 pKa = 7.7RR28 pKa = 11.84TNTPYY33 pKa = 10.93VIASEE38 pKa = 4.28FDD40 pKa = 3.16SSKK43 pKa = 9.79NTFIRR48 pKa = 11.84YY49 pKa = 8.61AIRR52 pKa = 11.84RR53 pKa = 11.84VGYY56 pKa = 9.93DD57 pKa = 3.15RR58 pKa = 11.84NVDD61 pKa = 3.75PDD63 pKa = 3.72KK64 pKa = 10.91STCIYY69 pKa = 10.51LKK71 pKa = 9.13TGKK74 pKa = 9.94EE75 pKa = 3.38IRR77 pKa = 11.84ITIKK81 pKa = 10.56YY82 pKa = 8.98YY83 pKa = 9.72IRR85 pKa = 11.84KK86 pKa = 8.93LFKK89 pKa = 10.62
Molecular weight: 10.68 kDa
Isoelectric point according different methods:
Peptides (in silico digests for buttom-up proteomics)
Below you can find in silico digests of the whole proteome with Trypsin, Chymotrypsin, Trypsin+LysC, LysN, ArgC proteases suitable for different mass spec machines.| Try ESI |
 |
|---|
| ChTry ESI |
|
|---|
| ArgC ESI |
|
|---|
| LysN ESI |
|
|---|
| TryLysC ESI |
|
|---|
| Try MALDI |
|
|---|
| ChTry MALDI |
|
|---|
| ArgC MALDI |
|
|---|
| LysN MALDI |
|
|---|
| TryLysC MALDI |
|
|---|
| Try LTQ |
|
|---|
| ChTry LTQ |
|
|---|
| ArgC LTQ |
|
|---|
| LysN LTQ |
|
|---|
| TryLysC LTQ |
|
|---|
| Try MSlow |
|
|---|
| ChTry MSlow |
|
|---|
| ArgC MSlow |
|
|---|
| LysN MSlow |
|
|---|
| TryLysC MSlow |
|
|---|
| Try MShigh |
|
|---|
| ChTry MShigh |
|
|---|
| ArgC MShigh |
|
|---|
| LysN MShigh |
|
|---|
| TryLysC MShigh |
|
|---|
General Statistics
Number of major isoforms |
Number of additional isoforms |
Number of all proteins |
Number of amino acids |
Min. Seq. Length |
Max. Seq. Length |
Avg. Seq. Length |
Avg. Mol. Weight |
|---|---|---|---|---|---|---|---|
0 |
81518 |
21 |
2553 |
222.1 |
25.36 |
Amino acid frequency
Ala |
Cys |
Asp |
Glu |
Phe |
Gly |
His |
Ile |
Lys |
Leu |
|---|---|---|---|---|---|---|---|---|---|
5.173 ± 0.194 | 0.889 ± 0.055 |
6.437 ± 0.116 | 6.606 ± 0.182 |
5.39 ± 0.097 | 4.956 ± 0.264 |
1.651 ± 0.081 | 8.089 ± 0.14 |
8.471 ± 0.192 | 8.469 ± 0.133 |
Met |
Asn |
Gln |
Pro |
Arg |
Ser |
Thr |
Val |
Trp |
Tyr |
|---|---|---|---|---|---|---|---|---|---|
2.622 ± 0.074 | 6.944 ± 0.113 |
3.085 ± 0.063 | 2.468 ± 0.074 |
3.965 ± 0.093 | 7.699 ± 0.146 |
5.921 ± 0.152 | 5.969 ± 0.096 |
0.655 ± 0.038 | 4.54 ± 0.14 |
Most of the basic statistics you can see at this page can be downloaded from this CSV file
See this proteome in:

Proteome-pI is available under Creative Commons Attribution-NoDerivs license, for more details see here
| Reference: Kozlowski LP. Proteome-pI 2.0: Proteome Isoelectric Point Database Update. Nucleic Acids Res. 2021, doi: 10.1093/nar/gkab944 | Contact: Lukasz P. Kozlowski |