Neolamprologus brichardi (Fairy cichlid) (Lamprologus brichardi)
Taxonomy: cellular organisms; Eukaryota; Opisthokonta; Metazoa; Eumetazoa; Bilateria; Deuterostomia; Chordata; Craniata; Vertebrata; Gnathostomata; Teleostomi; Euteleostomi; Actinopterygii; Actinopteri; Neopterygii; Teleostei; Osteoglossocephalai; Clupeocephala; Euteleosteomorpha; Neoteleostei; Eurypterygia; <
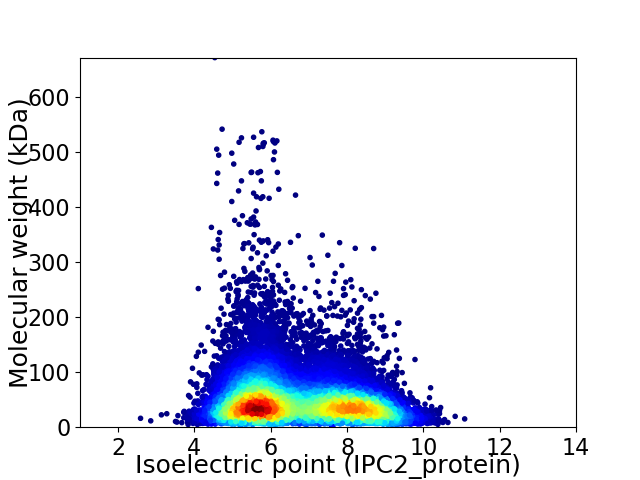
Average proteome isoelectric point is 6.69
Get precalculated fractions of proteins

Virtual 2D-PAGE plot for 31886 proteins (isoelectric point calculated using IPC2_protein)
Get csv file with sequences according to given criteria:
* You can choose from 21 different methods for calculating isoelectric point
Summary statistics related to proteome-wise predictions


Protein with the lowest isoelectric point:
>tr|A0A3Q4HUB6|A0A3Q4HUB6_NEOBR Ras and Rab interactor 2-like OS=Neolamprologus brichardi OX=32507 PE=3 SV=1
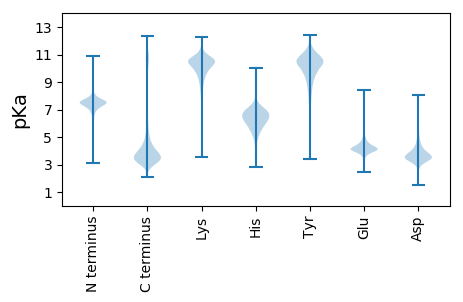
MM1 pKa = 7.25VLLNNLHH8 pKa = 6.89PPTEE12 pKa = 4.57GVRR15 pKa = 11.84HH16 pKa = 5.28EE17 pKa = 4.28QAEE20 pKa = 4.55TTAVMDD26 pKa = 4.39GQRR29 pKa = 11.84LGCGTLYY36 pKa = 10.64VAEE39 pKa = 4.69TRR41 pKa = 11.84LSWFDD46 pKa = 3.33SSGLGFSLEE55 pKa = 4.09YY56 pKa = 10.32PSIGLHH62 pKa = 6.16AISRR66 pKa = 11.84DD67 pKa = 3.08VSTYY71 pKa = 8.83PQEE74 pKa = 4.1HH75 pKa = 7.01LYY77 pKa = 11.61VMVNADD83 pKa = 4.5DD84 pKa = 5.95DD85 pKa = 5.32DD86 pKa = 5.99DD87 pKa = 5.3GSSDD91 pKa = 4.88GGDD94 pKa = 3.45DD95 pKa = 5.71DD96 pKa = 5.69EE97 pKa = 7.17DD98 pKa = 3.62EE99 pKa = 4.78GPITEE104 pKa = 4.09IRR106 pKa = 11.84FVPSDD111 pKa = 3.39KK112 pKa = 11.03AALEE116 pKa = 4.44SMFSAMCEE124 pKa = 4.24CQALHH129 pKa = 7.42PDD131 pKa = 4.21PEE133 pKa = 6.72DD134 pKa = 4.81DD135 pKa = 5.87DD136 pKa = 4.92SDD138 pKa = 3.91NDD140 pKa = 4.08FEE142 pKa = 4.91GEE144 pKa = 4.04EE145 pKa = 4.32YY146 pKa = 10.54DD147 pKa = 4.57VEE149 pKa = 4.43EE150 pKa = 5.21HH151 pKa = 5.7GHH153 pKa = 6.51ADD155 pKa = 2.67IPTFYY160 pKa = 10.26TCDD163 pKa = 3.46EE164 pKa = 4.43GLSALTQEE172 pKa = 4.67GQATLEE178 pKa = 4.09RR179 pKa = 11.84LEE181 pKa = 4.74GMLAQSVAQQYY192 pKa = 10.68HH193 pKa = 4.53MAGVRR198 pKa = 11.84TEE200 pKa = 3.81EE201 pKa = 4.05TKK203 pKa = 11.15AEE205 pKa = 4.17FEE207 pKa = 5.12DD208 pKa = 4.44GMEE211 pKa = 3.84VDD213 pKa = 4.04AAAMEE218 pKa = 4.63AGQFEE223 pKa = 4.69DD224 pKa = 4.94ADD226 pKa = 3.94VEE228 pKa = 4.44HH229 pKa = 7.03WW230 pKa = 3.45
MM1 pKa = 7.25VLLNNLHH8 pKa = 6.89PPTEE12 pKa = 4.57GVRR15 pKa = 11.84HH16 pKa = 5.28EE17 pKa = 4.28QAEE20 pKa = 4.55TTAVMDD26 pKa = 4.39GQRR29 pKa = 11.84LGCGTLYY36 pKa = 10.64VAEE39 pKa = 4.69TRR41 pKa = 11.84LSWFDD46 pKa = 3.33SSGLGFSLEE55 pKa = 4.09YY56 pKa = 10.32PSIGLHH62 pKa = 6.16AISRR66 pKa = 11.84DD67 pKa = 3.08VSTYY71 pKa = 8.83PQEE74 pKa = 4.1HH75 pKa = 7.01LYY77 pKa = 11.61VMVNADD83 pKa = 4.5DD84 pKa = 5.95DD85 pKa = 5.32DD86 pKa = 5.99DD87 pKa = 5.3GSSDD91 pKa = 4.88GGDD94 pKa = 3.45DD95 pKa = 5.71DD96 pKa = 5.69EE97 pKa = 7.17DD98 pKa = 3.62EE99 pKa = 4.78GPITEE104 pKa = 4.09IRR106 pKa = 11.84FVPSDD111 pKa = 3.39KK112 pKa = 11.03AALEE116 pKa = 4.44SMFSAMCEE124 pKa = 4.24CQALHH129 pKa = 7.42PDD131 pKa = 4.21PEE133 pKa = 6.72DD134 pKa = 4.81DD135 pKa = 5.87DD136 pKa = 4.92SDD138 pKa = 3.91NDD140 pKa = 4.08FEE142 pKa = 4.91GEE144 pKa = 4.04EE145 pKa = 4.32YY146 pKa = 10.54DD147 pKa = 4.57VEE149 pKa = 4.43EE150 pKa = 5.21HH151 pKa = 5.7GHH153 pKa = 6.51ADD155 pKa = 2.67IPTFYY160 pKa = 10.26TCDD163 pKa = 3.46EE164 pKa = 4.43GLSALTQEE172 pKa = 4.67GQATLEE178 pKa = 4.09RR179 pKa = 11.84LEE181 pKa = 4.74GMLAQSVAQQYY192 pKa = 10.68HH193 pKa = 4.53MAGVRR198 pKa = 11.84TEE200 pKa = 3.81EE201 pKa = 4.05TKK203 pKa = 11.15AEE205 pKa = 4.17FEE207 pKa = 5.12DD208 pKa = 4.44GMEE211 pKa = 3.84VDD213 pKa = 4.04AAAMEE218 pKa = 4.63AGQFEE223 pKa = 4.69DD224 pKa = 4.94ADD226 pKa = 3.94VEE228 pKa = 4.44HH229 pKa = 7.03WW230 pKa = 3.45
Molecular weight: 25.33 kDa
Isoelectric point according different methods:
Protein with the highest isoelectric point:
>tr|A0A3Q4HWT0|A0A3Q4HWT0_NEOBR Mitochondrial import receptor subunit TOM20 homolog OS=Neolamprologus brichardi OX=32507 PE=3 SV=1
RR1 pKa = 6.85GAKK4 pKa = 9.76GRR6 pKa = 11.84GRR8 pKa = 11.84GGRR11 pKa = 11.84MSRR14 pKa = 11.84GGMRR18 pKa = 11.84GGRR21 pKa = 11.84GMMKK25 pKa = 10.3GFGPPGPGRR34 pKa = 11.84GRR36 pKa = 11.84VKK38 pKa = 10.62DD39 pKa = 3.39GAMNGFGPMRR49 pKa = 11.84QPLLSISGWTHH60 pKa = 3.98GHH62 pKa = 6.27GPSSSPSPTSSYY74 pKa = 10.75APQRR78 pKa = 11.84HH79 pKa = 5.74GPAPPPPPGHH89 pKa = 6.49PGFRR93 pKa = 11.84GRR95 pKa = 11.84PPHH98 pKa = 5.54PRR100 pKa = 11.84GRR102 pKa = 11.84GMPPPGPPRR111 pKa = 11.84PFRR114 pKa = 11.84PYY116 pKa = 10.33HH117 pKa = 6.06NGPVSPPPHH126 pKa = 6.87PPPGRR131 pKa = 11.84GQRR134 pKa = 11.84WPGPPGGRR142 pKa = 11.84RR143 pKa = 11.84FF144 pKa = 3.46
RR1 pKa = 6.85GAKK4 pKa = 9.76GRR6 pKa = 11.84GRR8 pKa = 11.84GGRR11 pKa = 11.84MSRR14 pKa = 11.84GGMRR18 pKa = 11.84GGRR21 pKa = 11.84GMMKK25 pKa = 10.3GFGPPGPGRR34 pKa = 11.84GRR36 pKa = 11.84VKK38 pKa = 10.62DD39 pKa = 3.39GAMNGFGPMRR49 pKa = 11.84QPLLSISGWTHH60 pKa = 3.98GHH62 pKa = 6.27GPSSSPSPTSSYY74 pKa = 10.75APQRR78 pKa = 11.84HH79 pKa = 5.74GPAPPPPPGHH89 pKa = 6.49PGFRR93 pKa = 11.84GRR95 pKa = 11.84PPHH98 pKa = 5.54PRR100 pKa = 11.84GRR102 pKa = 11.84GMPPPGPPRR111 pKa = 11.84PFRR114 pKa = 11.84PYY116 pKa = 10.33HH117 pKa = 6.06NGPVSPPPHH126 pKa = 6.87PPPGRR131 pKa = 11.84GQRR134 pKa = 11.84WPGPPGGRR142 pKa = 11.84RR143 pKa = 11.84FF144 pKa = 3.46
Molecular weight: 15.05 kDa
Isoelectric point according different methods:
Peptides (in silico digests for buttom-up proteomics)
Below you can find in silico digests of the whole proteome with Trypsin, Chymotrypsin, Trypsin+LysC, LysN, ArgC proteases suitable for different mass spec machines.| Try ESI |
 |
|---|
| ChTry ESI |
 |
|---|
| ArgC ESI |
 |
|---|
| LysN ESI |
 |
|---|
| TryLysC ESI |
 |
|---|
| Try MALDI |
 |
|---|
| ChTry MALDI |
 |
|---|
| ArgC MALDI |
 |
|---|
| LysN MALDI |
 |
|---|
| TryLysC MALDI |
 |
|---|
| Try LTQ |
 |
|---|
| ChTry LTQ |
 |
|---|
| ArgC LTQ |
 |
|---|
| LysN LTQ |
 |
|---|
| TryLysC LTQ |
 |
|---|
| Try MSlow |
 |
|---|
| ChTry MSlow |
 |
|---|
| ArgC MSlow |
 |
|---|
| LysN MSlow |
 |
|---|
| TryLysC MSlow |
 |
|---|
| Try MShigh |
 |
|---|
| ChTry MShigh |
 |
|---|
| ArgC MShigh |
 |
|---|
| LysN MShigh |
 |
|---|
| TryLysC MShigh |
 |
|---|
General Statistics
Number of major isoforms |
Number of additional isoforms |
Number of all proteins |
Number of amino acids |
Min. Seq. Length |
Max. Seq. Length |
Avg. Seq. Length |
Avg. Mol. Weight |
|---|---|---|---|---|---|---|---|
14967379 |
17 |
6198 |
469.4 |
52.46 |
Amino acid frequency
Ala |
Cys |
Asp |
Glu |
Phe |
Gly |
His |
Ile |
Lys |
Leu |
|---|---|---|---|---|---|---|---|---|---|
6.357 ± 0.011 | 2.455 ± 0.011 |
5.047 ± 0.01 | 6.566 ± 0.017 |
3.96 ± 0.01 | 6.173 ± 0.016 |
2.682 ± 0.007 | 4.688 ± 0.011 |
5.724 ± 0.016 | 9.705 ± 0.017 |
Met |
Asn |
Gln |
Pro |
Arg |
Ser |
Thr |
Val |
Trp |
Tyr |
|---|---|---|---|---|---|---|---|---|---|
2.377 ± 0.006 | 3.961 ± 0.009 |
5.366 ± 0.016 | 4.543 ± 0.013 |
5.451 ± 0.011 | 8.495 ± 0.02 |
5.653 ± 0.009 | 6.444 ± 0.012 |
1.215 ± 0.005 | 2.937 ± 0.008 |
Most of the basic statistics you can see at this page can be downloaded from this CSV file
Proteome-pI is available under Creative Commons Attribution-NoDerivs license, for more details see here
| Reference: Kozlowski LP. Proteome-pI 2.0: Proteome Isoelectric Point Database Update. Nucleic Acids Res. 2021, doi: 10.1093/nar/gkab944 | Contact: Lukasz P. Kozlowski |
