Streptococcus virus Sfi11
Taxonomy: Viruses; Duplodnaviria; Heunggongvirae; Uroviricota; Caudoviricetes; Caudovirales; Siphoviridae; Brussowvirus
Average proteome isoelectric point is 6.38
Get precalculated fractions of proteins

Virtual 2D-PAGE plot for 51 proteins (isoelectric point calculated using IPC2_protein)
Get csv file with sequences according to given criteria:
* You can choose from 21 different methods for calculating isoelectric point
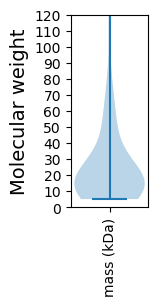
Summary statistics related to proteome-wise predictions


Protein with the lowest isoelectric point:
>tr|Q77PS8|Q77PS8_9CAUD Gp66 OS=Streptococcus virus Sfi11 OX=78541 PE=4 SV=1
MM1 pKa = 6.73TRR3 pKa = 11.84RR4 pKa = 11.84YY5 pKa = 8.53TKK7 pKa = 10.27MNVPQSLVNWFVNHH21 pKa = 6.78RR22 pKa = 11.84NLLTYY27 pKa = 11.07SMYY30 pKa = 10.88GSRR33 pKa = 11.84NGSDD37 pKa = 2.98GTADD41 pKa = 3.56CSGSMSQALKK51 pKa = 10.31EE52 pKa = 3.98AGIPIQGLPSTVTLGQQLAKK72 pKa = 10.58NGFYY76 pKa = 10.45RR77 pKa = 11.84ISRR80 pKa = 11.84NEE82 pKa = 3.68DD83 pKa = 2.64WNAEE87 pKa = 4.08TGDD90 pKa = 3.78IVLMSWGADD99 pKa = 3.28MASSGGAGGHH109 pKa = 5.79VGVMMDD115 pKa = 3.6SVNFICCDD123 pKa = 3.31YY124 pKa = 9.67STQGAAGQAINTYY137 pKa = 8.75PWNDD141 pKa = 3.22YY142 pKa = 11.23YY143 pKa = 11.03EE144 pKa = 4.53ANKK147 pKa = 9.11PAYY150 pKa = 9.19IEE152 pKa = 3.71VWRR155 pKa = 11.84YY156 pKa = 10.23SEE158 pKa = 5.29SAPQTKK164 pKa = 9.54NQANTAVTPQQKK176 pKa = 10.45AYY178 pKa = 11.02YY179 pKa = 8.08EE180 pKa = 4.27ANEE183 pKa = 3.96VKK185 pKa = 10.25YY186 pKa = 11.21VNGIWQIKK194 pKa = 9.37CDD196 pKa = 4.03YY197 pKa = 9.83LSPIGFDD204 pKa = 3.35YY205 pKa = 11.16LEE207 pKa = 4.4NGIPVTMVNWVDD219 pKa = 3.69KK220 pKa = 11.03DD221 pKa = 4.24GNDD224 pKa = 3.97LPDD227 pKa = 4.77GADD230 pKa = 3.18QDD232 pKa = 4.92FKK234 pKa = 11.67AGMYY238 pKa = 10.22FSFSSDD244 pKa = 2.71EE245 pKa = 4.23TNIVDD250 pKa = 3.86TGNGGYY256 pKa = 10.39YY257 pKa = 10.01GGYY260 pKa = 7.73YY261 pKa = 8.88WRR263 pKa = 11.84LFEE266 pKa = 5.07FGQFGPVWLSCWNKK280 pKa = 10.66DD281 pKa = 3.89DD282 pKa = 5.14LVNYY286 pKa = 7.38YY287 pKa = 8.26QQ288 pKa = 4.22
MM1 pKa = 6.73TRR3 pKa = 11.84RR4 pKa = 11.84YY5 pKa = 8.53TKK7 pKa = 10.27MNVPQSLVNWFVNHH21 pKa = 6.78RR22 pKa = 11.84NLLTYY27 pKa = 11.07SMYY30 pKa = 10.88GSRR33 pKa = 11.84NGSDD37 pKa = 2.98GTADD41 pKa = 3.56CSGSMSQALKK51 pKa = 10.31EE52 pKa = 3.98AGIPIQGLPSTVTLGQQLAKK72 pKa = 10.58NGFYY76 pKa = 10.45RR77 pKa = 11.84ISRR80 pKa = 11.84NEE82 pKa = 3.68DD83 pKa = 2.64WNAEE87 pKa = 4.08TGDD90 pKa = 3.78IVLMSWGADD99 pKa = 3.28MASSGGAGGHH109 pKa = 5.79VGVMMDD115 pKa = 3.6SVNFICCDD123 pKa = 3.31YY124 pKa = 9.67STQGAAGQAINTYY137 pKa = 8.75PWNDD141 pKa = 3.22YY142 pKa = 11.23YY143 pKa = 11.03EE144 pKa = 4.53ANKK147 pKa = 9.11PAYY150 pKa = 9.19IEE152 pKa = 3.71VWRR155 pKa = 11.84YY156 pKa = 10.23SEE158 pKa = 5.29SAPQTKK164 pKa = 9.54NQANTAVTPQQKK176 pKa = 10.45AYY178 pKa = 11.02YY179 pKa = 8.08EE180 pKa = 4.27ANEE183 pKa = 3.96VKK185 pKa = 10.25YY186 pKa = 11.21VNGIWQIKK194 pKa = 9.37CDD196 pKa = 4.03YY197 pKa = 9.83LSPIGFDD204 pKa = 3.35YY205 pKa = 11.16LEE207 pKa = 4.4NGIPVTMVNWVDD219 pKa = 3.69KK220 pKa = 11.03DD221 pKa = 4.24GNDD224 pKa = 3.97LPDD227 pKa = 4.77GADD230 pKa = 3.18QDD232 pKa = 4.92FKK234 pKa = 11.67AGMYY238 pKa = 10.22FSFSSDD244 pKa = 2.71EE245 pKa = 4.23TNIVDD250 pKa = 3.86TGNGGYY256 pKa = 10.39YY257 pKa = 10.01GGYY260 pKa = 7.73YY261 pKa = 8.88WRR263 pKa = 11.84LFEE266 pKa = 5.07FGQFGPVWLSCWNKK280 pKa = 10.66DD281 pKa = 3.89DD282 pKa = 5.14LVNYY286 pKa = 7.38YY287 pKa = 8.26QQ288 pKa = 4.22
Molecular weight: 32.24 kDa
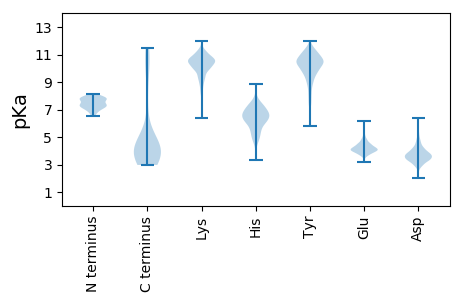
Isoelectric point according different methods:
Protein with the highest isoelectric point:
>tr|Q9MCH7|Q9MCH7_9CAUD Gp236 OS=Streptococcus virus Sfi11 OX=78541 PE=4 SV=1
MM1 pKa = 6.88FVSWVKK7 pKa = 9.47TKK9 pKa = 10.51KK10 pKa = 9.95DD11 pKa = 3.14RR12 pKa = 11.84HH13 pKa = 5.0NCRR16 pKa = 11.84HH17 pKa = 4.94FMKK20 pKa = 10.63VNTTIISEE28 pKa = 4.28RR29 pKa = 11.84LDD31 pKa = 3.09QCYY34 pKa = 9.92CRR36 pKa = 11.84KK37 pKa = 10.03LMRR40 pKa = 11.84KK41 pKa = 7.06QHH43 pKa = 6.18SNVANASFEE52 pKa = 4.43NIHH55 pKa = 6.89AGEE58 pKa = 4.18RR59 pKa = 11.84LHH61 pKa = 7.1TIALNRR67 pKa = 11.84KK68 pKa = 8.14
MM1 pKa = 6.88FVSWVKK7 pKa = 9.47TKK9 pKa = 10.51KK10 pKa = 9.95DD11 pKa = 3.14RR12 pKa = 11.84HH13 pKa = 5.0NCRR16 pKa = 11.84HH17 pKa = 4.94FMKK20 pKa = 10.63VNTTIISEE28 pKa = 4.28RR29 pKa = 11.84LDD31 pKa = 3.09QCYY34 pKa = 9.92CRR36 pKa = 11.84KK37 pKa = 10.03LMRR40 pKa = 11.84KK41 pKa = 7.06QHH43 pKa = 6.18SNVANASFEE52 pKa = 4.43NIHH55 pKa = 6.89AGEE58 pKa = 4.18RR59 pKa = 11.84LHH61 pKa = 7.1TIALNRR67 pKa = 11.84KK68 pKa = 8.14
Molecular weight: 8.14 kDa
Isoelectric point according different methods:
Peptides (in silico digests for buttom-up proteomics)
Below you can find in silico digests of the whole proteome with Trypsin, Chymotrypsin, Trypsin+LysC, LysN, ArgC proteases suitable for different mass spec machines.| Try ESI |
 |
|---|
| ChTry ESI |
 |
|---|
| ArgC ESI |
 |
|---|
| LysN ESI |
 |
|---|
| TryLysC ESI |
 |
|---|
| Try MALDI |
 |
|---|
| ChTry MALDI |
 |
|---|
| ArgC MALDI |
 |
|---|
| LysN MALDI |
 |
|---|
| TryLysC MALDI |
 |
|---|
| Try LTQ |
 |
|---|
| ChTry LTQ |
 |
|---|
| ArgC LTQ |
 |
|---|
| LysN LTQ |
 |
|---|
| TryLysC LTQ |
 |
|---|
| Try MSlow |
 |
|---|
| ChTry MSlow |
 |
|---|
| ArgC MSlow |
 |
|---|
| LysN MSlow |
 |
|---|
| TryLysC MSlow |
 |
|---|
| Try MShigh |
 |
|---|
| ChTry MShigh |
 |
|---|
| ArgC MShigh |
 |
|---|
| LysN MShigh |
 |
|---|
| TryLysC MShigh |
 |
|---|
General Statistics
Number of major isoforms |
Number of additional isoforms |
Number of all proteins |
Number of amino acids |
Min. Seq. Length |
Max. Seq. Length |
Avg. Seq. Length |
Avg. Mol. Weight |
|---|---|---|---|---|---|---|---|
0 |
12264 |
40 |
1510 |
240.5 |
26.97 |
Amino acid frequency
Ala |
Cys |
Asp |
Glu |
Phe |
Gly |
His |
Ile |
Lys |
Leu |
|---|---|---|---|---|---|---|---|---|---|
7.339 ± 0.965 | 0.53 ± 0.098 |
6.173 ± 0.484 | 6.556 ± 0.613 |
4.069 ± 0.179 | 6.947 ± 0.409 |
1.256 ± 0.187 | 6.988 ± 0.401 |
7.648 ± 0.504 | 7.616 ± 0.272 |
Met |
Asn |
Gln |
Pro |
Arg |
Ser |
Thr |
Val |
Trp |
Tyr |
|---|---|---|---|---|---|---|---|---|---|
2.365 ± 0.278 | 6.05 ± 0.363 |
2.919 ± 0.212 | 3.735 ± 0.259 |
4.207 ± 0.347 | 6.898 ± 0.664 |
6.703 ± 0.429 | 6.474 ± 0.263 |
1.337 ± 0.162 | 4.191 ± 0.446 |
Most of the basic statistics you can see at this page can be downloaded from this CSV file
Proteome-pI is available under Creative Commons Attribution-NoDerivs license, for more details see here
| Reference: Kozlowski LP. Proteome-pI 2.0: Proteome Isoelectric Point Database Update. Nucleic Acids Res. 2021, doi: 10.1093/nar/gkab944 | Contact: Lukasz P. Kozlowski |
