Yaba-like disease virus (YLDV)
Taxonomy: Viruses; Varidnaviria; Bamfordvirae; Nucleocytoviricota; Pokkesviricetes; Chitovirales; Poxviridae; Chordopoxvirinae; Yatapoxvirus; Tanapox virus
Average proteome isoelectric point is 7.32
Get precalculated fractions of proteins

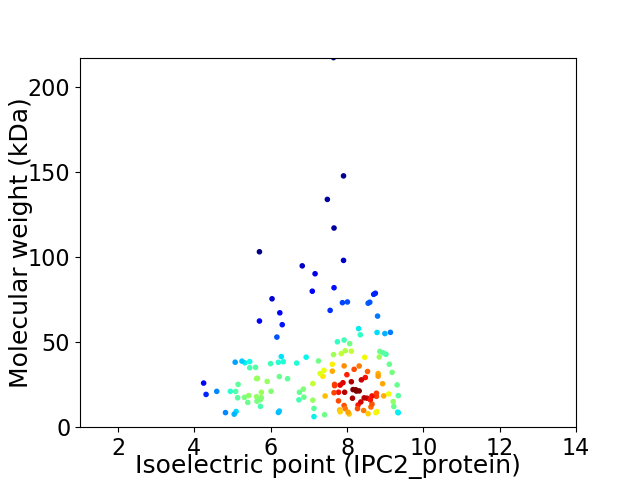
Virtual 2D-PAGE plot for 150 proteins (isoelectric point calculated using IPC2_protein)
Get csv file with sequences according to given criteria:
* You can choose from 21 different methods for calculating isoelectric point
Summary statistics related to proteome-wise predictions


Protein with the lowest isoelectric point:
>tr|Q9DHI9|Q9DHI9_YLDV 124R protein OS=Yaba-like disease virus OX=132475 GN=124R PE=4 SV=1
MM1 pKa = 7.95IIPYY5 pKa = 9.96IIVSCSLIILIVYY18 pKa = 8.93LFLINKK24 pKa = 8.61KK25 pKa = 8.59YY26 pKa = 10.41CKK28 pKa = 10.18KK29 pKa = 10.33FLKK32 pKa = 10.41KK33 pKa = 10.01KK34 pKa = 9.88NKK36 pKa = 8.72PVCIEE41 pKa = 4.01LKK43 pKa = 10.69KK44 pKa = 9.69ITNTNKK50 pKa = 9.68TSTLNSEE57 pKa = 4.61DD58 pKa = 3.41WTDD61 pKa = 3.29MGSCEE66 pKa = 3.51IYY68 pKa = 11.19ANFRR72 pKa = 11.84SSKK75 pKa = 9.78RR76 pKa = 11.84EE77 pKa = 3.53KK78 pKa = 10.63SFKK81 pKa = 10.98LKK83 pKa = 10.71DD84 pKa = 3.49EE85 pKa = 4.29QQNSSSTSSSDD96 pKa = 3.5SEE98 pKa = 4.08FDD100 pKa = 3.42STINTDD106 pKa = 4.41DD107 pKa = 4.17EE108 pKa = 4.77SEE110 pKa = 4.09KK111 pKa = 11.14LNWDD115 pKa = 3.52NEE117 pKa = 4.37EE118 pKa = 3.79YY119 pKa = 10.45KK120 pKa = 10.6YY121 pKa = 11.02DD122 pKa = 3.79YY123 pKa = 10.66GKK125 pKa = 10.36SEE127 pKa = 4.05STVYY131 pKa = 10.72DD132 pKa = 4.25LPQDD136 pKa = 4.25NITEE140 pKa = 4.13DD141 pKa = 3.16TVYY144 pKa = 11.11DD145 pKa = 3.57VTDD148 pKa = 3.31NVEE151 pKa = 4.32NITYY155 pKa = 9.75DD156 pKa = 3.77LPQDD160 pKa = 3.98SIIYY164 pKa = 10.31DD165 pKa = 3.98LDD167 pKa = 3.83GKK169 pKa = 11.15SDD171 pKa = 3.48VAVYY175 pKa = 9.31DD176 pKa = 3.63IPEE179 pKa = 4.39SEE181 pKa = 4.63DD182 pKa = 3.32NVYY185 pKa = 10.99EE186 pKa = 4.13NNICLEE192 pKa = 4.06SCFDD196 pKa = 3.73DD197 pKa = 3.97VKK199 pKa = 11.51YY200 pKa = 11.05NSPLNNFNKK209 pKa = 10.24NYY211 pKa = 10.48YY212 pKa = 10.21SYY214 pKa = 9.77NTNDD218 pKa = 3.04FVSNVV223 pKa = 3.15
MM1 pKa = 7.95IIPYY5 pKa = 9.96IIVSCSLIILIVYY18 pKa = 8.93LFLINKK24 pKa = 8.61KK25 pKa = 8.59YY26 pKa = 10.41CKK28 pKa = 10.18KK29 pKa = 10.33FLKK32 pKa = 10.41KK33 pKa = 10.01KK34 pKa = 9.88NKK36 pKa = 8.72PVCIEE41 pKa = 4.01LKK43 pKa = 10.69KK44 pKa = 9.69ITNTNKK50 pKa = 9.68TSTLNSEE57 pKa = 4.61DD58 pKa = 3.41WTDD61 pKa = 3.29MGSCEE66 pKa = 3.51IYY68 pKa = 11.19ANFRR72 pKa = 11.84SSKK75 pKa = 9.78RR76 pKa = 11.84EE77 pKa = 3.53KK78 pKa = 10.63SFKK81 pKa = 10.98LKK83 pKa = 10.71DD84 pKa = 3.49EE85 pKa = 4.29QQNSSSTSSSDD96 pKa = 3.5SEE98 pKa = 4.08FDD100 pKa = 3.42STINTDD106 pKa = 4.41DD107 pKa = 4.17EE108 pKa = 4.77SEE110 pKa = 4.09KK111 pKa = 11.14LNWDD115 pKa = 3.52NEE117 pKa = 4.37EE118 pKa = 3.79YY119 pKa = 10.45KK120 pKa = 10.6YY121 pKa = 11.02DD122 pKa = 3.79YY123 pKa = 10.66GKK125 pKa = 10.36SEE127 pKa = 4.05STVYY131 pKa = 10.72DD132 pKa = 4.25LPQDD136 pKa = 4.25NITEE140 pKa = 4.13DD141 pKa = 3.16TVYY144 pKa = 11.11DD145 pKa = 3.57VTDD148 pKa = 3.31NVEE151 pKa = 4.32NITYY155 pKa = 9.75DD156 pKa = 3.77LPQDD160 pKa = 3.98SIIYY164 pKa = 10.31DD165 pKa = 3.98LDD167 pKa = 3.83GKK169 pKa = 11.15SDD171 pKa = 3.48VAVYY175 pKa = 9.31DD176 pKa = 3.63IPEE179 pKa = 4.39SEE181 pKa = 4.63DD182 pKa = 3.32NVYY185 pKa = 10.99EE186 pKa = 4.13NNICLEE192 pKa = 4.06SCFDD196 pKa = 3.73DD197 pKa = 3.97VKK199 pKa = 11.51YY200 pKa = 11.05NSPLNNFNKK209 pKa = 10.24NYY211 pKa = 10.48YY212 pKa = 10.21SYY214 pKa = 9.77NTNDD218 pKa = 3.04FVSNVV223 pKa = 3.15
Molecular weight: 25.92 kDa
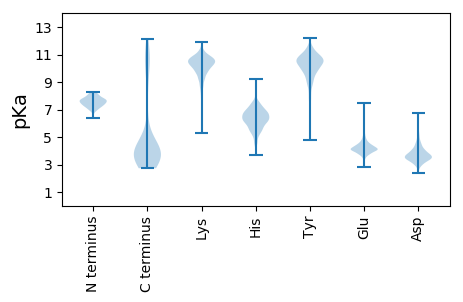
Isoelectric point according different methods:
Protein with the highest isoelectric point:
>tr|Q9DHR7|Q9DHR7_YLDV 45L protein OS=Yaba-like disease virus OX=132475 GN=45L PE=4 SV=1
MM1 pKa = 7.49ALSTRR6 pKa = 11.84EE7 pKa = 3.79IFSAIGITCMALLMIVSGGALAFKK31 pKa = 10.48SLAPHH36 pKa = 6.49RR37 pKa = 11.84VISMRR42 pKa = 11.84SVTFNKK48 pKa = 9.88VITILEE54 pKa = 4.36YY55 pKa = 9.75IAILIFVPGTIALYY69 pKa = 9.93SAYY72 pKa = 9.58IKK74 pKa = 9.84TLIVGG79 pKa = 4.05
MM1 pKa = 7.49ALSTRR6 pKa = 11.84EE7 pKa = 3.79IFSAIGITCMALLMIVSGGALAFKK31 pKa = 10.48SLAPHH36 pKa = 6.49RR37 pKa = 11.84VISMRR42 pKa = 11.84SVTFNKK48 pKa = 9.88VITILEE54 pKa = 4.36YY55 pKa = 9.75IAILIFVPGTIALYY69 pKa = 9.93SAYY72 pKa = 9.58IKK74 pKa = 9.84TLIVGG79 pKa = 4.05
Molecular weight: 8.51 kDa
Isoelectric point according different methods:
Peptides (in silico digests for buttom-up proteomics)
Below you can find in silico digests of the whole proteome with Trypsin, Chymotrypsin, Trypsin+LysC, LysN, ArgC proteases suitable for different mass spec machines.| Try ESI |
 |
|---|
| ChTry ESI |
 |
|---|
| ArgC ESI |
 |
|---|
| LysN ESI |
 |
|---|
| TryLysC ESI |
 |
|---|
| Try MALDI |
 |
|---|
| ChTry MALDI |
 |
|---|
| ArgC MALDI |
 |
|---|
| LysN MALDI |
 |
|---|
| TryLysC MALDI |
 |
|---|
| Try LTQ |
 |
|---|
| ChTry LTQ |
 |
|---|
| ArgC LTQ |
 |
|---|
| LysN LTQ |
 |
|---|
| TryLysC LTQ |
 |
|---|
| Try MSlow |
 |
|---|
| ChTry MSlow |
 |
|---|
| ArgC MSlow |
 |
|---|
| LysN MSlow |
 |
|---|
| TryLysC MSlow |
 |
|---|
| Try MShigh |
 |
|---|
| ChTry MShigh |
 |
|---|
| ArgC MShigh |
 |
|---|
| LysN MShigh |
 |
|---|
| TryLysC MShigh |
 |
|---|
General Statistics
Number of major isoforms |
Number of additional isoforms |
Number of all proteins |
Number of amino acids |
Min. Seq. Length |
Max. Seq. Length |
Avg. Seq. Length |
Avg. Mol. Weight |
|---|---|---|---|---|---|---|---|
0 |
45790 |
53 |
1901 |
305.3 |
35.3 |
Amino acid frequency
Ala |
Cys |
Asp |
Glu |
Phe |
Gly |
His |
Ile |
Lys |
Leu |
|---|---|---|---|---|---|---|---|---|---|
2.813 ± 0.121 | 2.16 ± 0.098 |
5.337 ± 0.125 | 5.364 ± 0.141 |
5.844 ± 0.121 | 3.542 ± 0.119 |
1.581 ± 0.081 | 10.29 ± 0.185 |
9.777 ± 0.18 | 9.292 ± 0.179 |
Met |
Asn |
Gln |
Pro |
Arg |
Ser |
Thr |
Val |
Trp |
Tyr |
|---|---|---|---|---|---|---|---|---|---|
2.326 ± 0.083 | 8.812 ± 0.197 |
2.819 ± 0.095 | 2.018 ± 0.075 |
2.669 ± 0.099 | 7.938 ± 0.164 |
5.259 ± 0.131 | 6.283 ± 0.133 |
0.66 ± 0.044 | 5.215 ± 0.122 |
Most of the basic statistics you can see at this page can be downloaded from this CSV file
Proteome-pI is available under Creative Commons Attribution-NoDerivs license, for more details see here
| Reference: Kozlowski LP. Proteome-pI 2.0: Proteome Isoelectric Point Database Update. Nucleic Acids Res. 2021, doi: 10.1093/nar/gkab944 | Contact: Lukasz P. Kozlowski |
