Natronomonas sp. CBA1133
Taxonomy: cellular organisms; Archaea; Euryarchaeota; Stenosarchaea group; Halobacteria; Halobacteriales; Haloarculaceae; Natronomonas; unclassified Natronomonas
Average proteome isoelectric point is 4.89
Get precalculated fractions of proteins
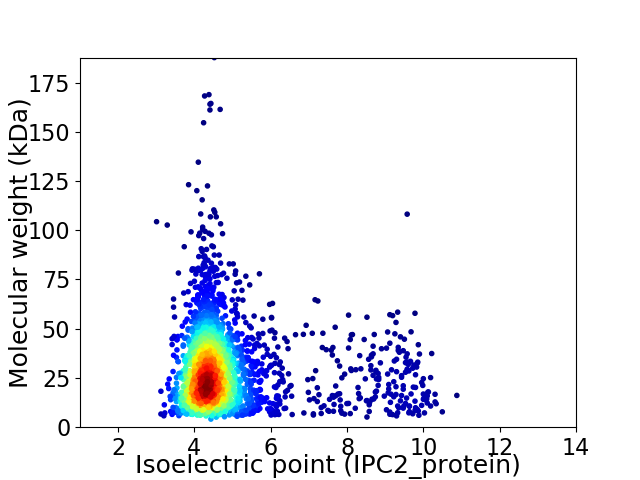
Virtual 2D-PAGE plot for 2582 proteins (isoelectric point calculated using IPC2_protein)
Get csv file with sequences according to given criteria:
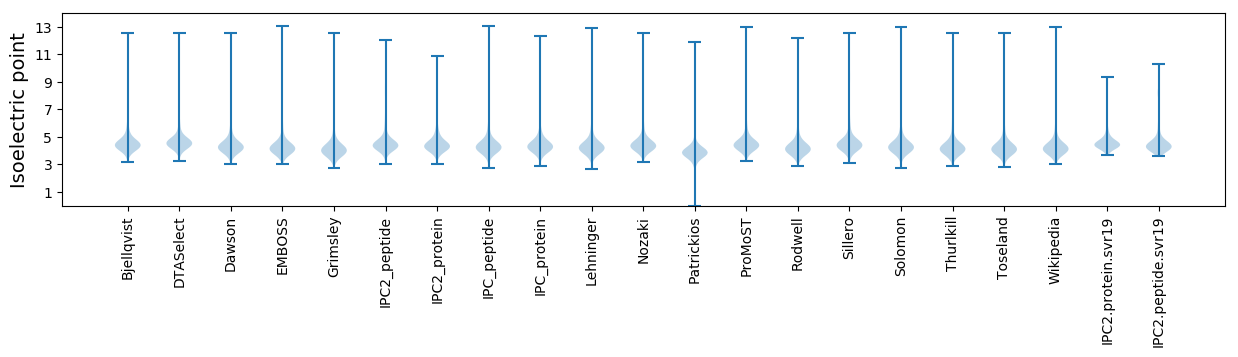
* You can choose from 21 different methods for calculating isoelectric point
Summary statistics related to proteome-wise predictions
Protein with the lowest isoelectric point:
>tr|A0A3M9VVT8|A0A3M9VVT8_9EURY Uncharacterized protein OS=Natronomonas sp. CBA1133 OX=2487041 GN=Nmn1133_09815 PE=4 SV=1
MM1 pKa = 7.04VQTDD5 pKa = 4.04SDD7 pKa = 4.06SQLQRR12 pKa = 11.84GDD14 pKa = 3.68LAPDD18 pKa = 3.71FRR20 pKa = 11.84LVGTEE25 pKa = 4.05GAHH28 pKa = 4.69YY29 pKa = 9.49TPDD32 pKa = 3.31SFADD36 pKa = 3.4NDD38 pKa = 3.67ALLVVFTCNHH48 pKa = 5.68CPYY51 pKa = 10.32AKK53 pKa = 10.56AKK55 pKa = 9.01FAPLNAIAEE64 pKa = 4.5EE65 pKa = 4.26YY66 pKa = 10.64DD67 pKa = 3.29DD68 pKa = 4.48CAVVGINPNDD78 pKa = 3.79ADD80 pKa = 4.35EE81 pKa = 5.09YY82 pKa = 10.65PDD84 pKa = 4.12DD85 pKa = 4.39SYY87 pKa = 12.04EE88 pKa = 4.15RR89 pKa = 11.84MCEE92 pKa = 3.91LVDD95 pKa = 5.28DD96 pKa = 4.38GTIGYY101 pKa = 8.47DD102 pKa = 3.06AYY104 pKa = 11.37LRR106 pKa = 11.84DD107 pKa = 4.19DD108 pKa = 4.7DD109 pKa = 5.34GSVAEE114 pKa = 5.28AYY116 pKa = 10.08GAVCTPDD123 pKa = 3.18PFLFARR129 pKa = 11.84EE130 pKa = 3.97DD131 pKa = 4.11GEE133 pKa = 4.13WRR135 pKa = 11.84LAYY138 pKa = 9.98HH139 pKa = 6.71GRR141 pKa = 11.84LDD143 pKa = 4.79DD144 pKa = 5.24ALNPDD149 pKa = 5.0DD150 pKa = 5.07EE151 pKa = 5.05PSGEE155 pKa = 4.02PGFEE159 pKa = 3.54VRR161 pKa = 11.84QAIDD165 pKa = 3.23AVLSGEE171 pKa = 4.4DD172 pKa = 3.97VSLEE176 pKa = 4.21DD177 pKa = 3.85NPSRR181 pKa = 11.84GCSIKK186 pKa = 10.16WPSAA190 pKa = 3.13
MM1 pKa = 7.04VQTDD5 pKa = 4.04SDD7 pKa = 4.06SQLQRR12 pKa = 11.84GDD14 pKa = 3.68LAPDD18 pKa = 3.71FRR20 pKa = 11.84LVGTEE25 pKa = 4.05GAHH28 pKa = 4.69YY29 pKa = 9.49TPDD32 pKa = 3.31SFADD36 pKa = 3.4NDD38 pKa = 3.67ALLVVFTCNHH48 pKa = 5.68CPYY51 pKa = 10.32AKK53 pKa = 10.56AKK55 pKa = 9.01FAPLNAIAEE64 pKa = 4.5EE65 pKa = 4.26YY66 pKa = 10.64DD67 pKa = 3.29DD68 pKa = 4.48CAVVGINPNDD78 pKa = 3.79ADD80 pKa = 4.35EE81 pKa = 5.09YY82 pKa = 10.65PDD84 pKa = 4.12DD85 pKa = 4.39SYY87 pKa = 12.04EE88 pKa = 4.15RR89 pKa = 11.84MCEE92 pKa = 3.91LVDD95 pKa = 5.28DD96 pKa = 4.38GTIGYY101 pKa = 8.47DD102 pKa = 3.06AYY104 pKa = 11.37LRR106 pKa = 11.84DD107 pKa = 4.19DD108 pKa = 4.7DD109 pKa = 5.34GSVAEE114 pKa = 5.28AYY116 pKa = 10.08GAVCTPDD123 pKa = 3.18PFLFARR129 pKa = 11.84EE130 pKa = 3.97DD131 pKa = 4.11GEE133 pKa = 4.13WRR135 pKa = 11.84LAYY138 pKa = 9.98HH139 pKa = 6.71GRR141 pKa = 11.84LDD143 pKa = 4.79DD144 pKa = 5.24ALNPDD149 pKa = 5.0DD150 pKa = 5.07EE151 pKa = 5.05PSGEE155 pKa = 4.02PGFEE159 pKa = 3.54VRR161 pKa = 11.84QAIDD165 pKa = 3.23AVLSGEE171 pKa = 4.4DD172 pKa = 3.97VSLEE176 pKa = 4.21DD177 pKa = 3.85NPSRR181 pKa = 11.84GCSIKK186 pKa = 10.16WPSAA190 pKa = 3.13
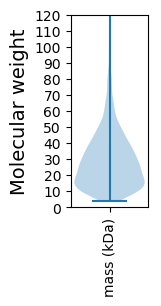
Molecular weight: 20.77 kDa
Isoelectric point according different methods:
Protein with the highest isoelectric point:
>tr|A0A3M9VGD9|A0A3M9VGD9_9EURY Uncharacterized protein OS=Natronomonas sp. CBA1133 OX=2487041 GN=Nmn1133_12940 PE=4 SV=1
MM1 pKa = 7.51KK2 pKa = 10.44SKK4 pKa = 9.2STRR7 pKa = 11.84SGIGRR12 pKa = 11.84VPSIFFATPTGISAPTRR29 pKa = 11.84SGQYY33 pKa = 9.12ATTSTAWKK41 pKa = 9.79LRR43 pKa = 11.84RR44 pKa = 11.84KK45 pKa = 9.0PVSPPNPLPSCRR57 pKa = 11.84GTTSKK62 pKa = 10.7SICGRR67 pKa = 11.84STTSKK72 pKa = 9.37STASPHH78 pKa = 5.1QRR80 pKa = 11.84LASGQFFARR89 pKa = 11.84TKK91 pKa = 8.53PVKK94 pKa = 9.98FVRR97 pKa = 11.84SFRR100 pKa = 11.84SCATLSPRR108 pKa = 11.84SMRR111 pKa = 11.84STASGSRR118 pKa = 11.84RR119 pKa = 11.84PFSRR123 pKa = 11.84APRR126 pKa = 11.84PSWHH130 pKa = 6.75SIRR133 pKa = 11.84PIRR136 pKa = 11.84HH137 pKa = 5.63RR138 pKa = 11.84GSRR141 pKa = 11.84RR142 pKa = 11.84PLTLVV147 pKa = 3.05
MM1 pKa = 7.51KK2 pKa = 10.44SKK4 pKa = 9.2STRR7 pKa = 11.84SGIGRR12 pKa = 11.84VPSIFFATPTGISAPTRR29 pKa = 11.84SGQYY33 pKa = 9.12ATTSTAWKK41 pKa = 9.79LRR43 pKa = 11.84RR44 pKa = 11.84KK45 pKa = 9.0PVSPPNPLPSCRR57 pKa = 11.84GTTSKK62 pKa = 10.7SICGRR67 pKa = 11.84STTSKK72 pKa = 9.37STASPHH78 pKa = 5.1QRR80 pKa = 11.84LASGQFFARR89 pKa = 11.84TKK91 pKa = 8.53PVKK94 pKa = 9.98FVRR97 pKa = 11.84SFRR100 pKa = 11.84SCATLSPRR108 pKa = 11.84SMRR111 pKa = 11.84STASGSRR118 pKa = 11.84RR119 pKa = 11.84PFSRR123 pKa = 11.84APRR126 pKa = 11.84PSWHH130 pKa = 6.75SIRR133 pKa = 11.84PIRR136 pKa = 11.84HH137 pKa = 5.63RR138 pKa = 11.84GSRR141 pKa = 11.84RR142 pKa = 11.84PLTLVV147 pKa = 3.05
Molecular weight: 16.13 kDa
Isoelectric point according different methods:
Peptides (in silico digests for buttom-up proteomics)
Below you can find in silico digests of the whole proteome with Trypsin, Chymotrypsin, Trypsin+LysC, LysN, ArgC proteases suitable for different mass spec machines.| Try ESI |
 |
|---|
| ChTry ESI |
|
|---|
| ArgC ESI |
|
|---|
| LysN ESI |
|
|---|
| TryLysC ESI |
|
|---|
| Try MALDI |
|
|---|
| ChTry MALDI |
|
|---|
| ArgC MALDI |
|
|---|
| LysN MALDI |
|
|---|
| TryLysC MALDI |
|
|---|
| Try LTQ |
|
|---|
| ChTry LTQ |
|
|---|
| ArgC LTQ |
|
|---|
| LysN LTQ |
|
|---|
| TryLysC LTQ |
|
|---|
| Try MSlow |
|
|---|
| ChTry MSlow |
|
|---|
| ArgC MSlow |
|
|---|
| LysN MSlow |
|
|---|
| TryLysC MSlow |
|
|---|
| Try MShigh |
|
|---|
| ChTry MShigh |
|
|---|
| ArgC MShigh |
|
|---|
| LysN MShigh |
|
|---|
| TryLysC MShigh |
|
|---|
General Statistics
Number of major isoforms |
Number of additional isoforms |
Number of all proteins |
Number of amino acids |
Min. Seq. Length |
Max. Seq. Length |
Avg. Seq. Length |
Avg. Mol. Weight |
|---|---|---|---|---|---|---|---|
0 |
718440 |
42 |
1687 |
278.2 |
30.21 |
Amino acid frequency
Ala |
Cys |
Asp |
Glu |
Phe |
Gly |
His |
Ile |
Lys |
Leu |
|---|---|---|---|---|---|---|---|---|---|
11.147 ± 0.074 | 0.733 ± 0.016 |
8.294 ± 0.056 | 8.431 ± 0.07 |
3.301 ± 0.029 | 8.432 ± 0.048 |
2.003 ± 0.023 | 3.941 ± 0.041 |
1.789 ± 0.027 | 9.028 ± 0.058 |
Met |
Asn |
Gln |
Pro |
Arg |
Ser |
Thr |
Val |
Trp |
Tyr |
|---|---|---|---|---|---|---|---|---|---|
1.713 ± 0.02 | 2.309 ± 0.027 |
4.655 ± 0.03 | 2.677 ± 0.03 |
6.608 ± 0.048 | 5.441 ± 0.041 |
6.852 ± 0.041 | 8.898 ± 0.054 |
1.06 ± 0.017 | 2.686 ± 0.026 |
Most of the basic statistics you can see at this page can be downloaded from this CSV file
See this proteome in:

Proteome-pI is available under Creative Commons Attribution-NoDerivs license, for more details see here
| Reference: Kozlowski LP. Proteome-pI 2.0: Proteome Isoelectric Point Database Update. Nucleic Acids Res. 2021, doi: 10.1093/nar/gkab944 | Contact: Lukasz P. Kozlowski |