bacterium 1XD42-8
Taxonomy: cellular organisms; Bacteria; unclassified Bacteria
Average proteome isoelectric point is 6.37
Get precalculated fractions of proteins

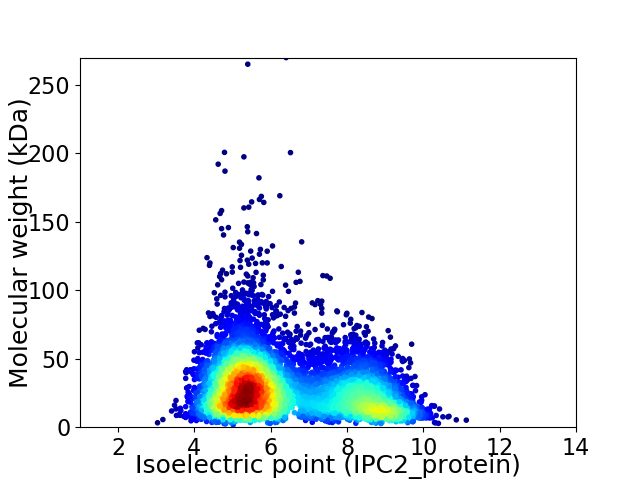
Virtual 2D-PAGE plot for 7100 proteins (isoelectric point calculated using IPC2_protein)
Get csv file with sequences according to given criteria:
* You can choose from 21 different methods for calculating isoelectric point
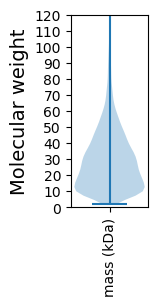
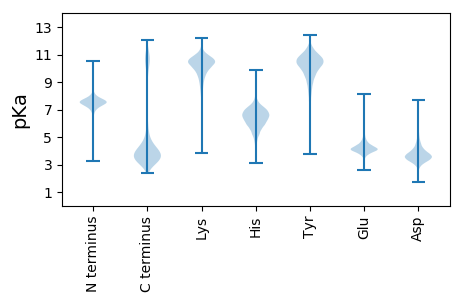
Summary statistics related to proteome-wise predictions


Protein with the lowest isoelectric point:
>tr|A0A3A9FS86|A0A3A9FS86_9BACT Metallopeptidase OS=bacterium 1XD42-8 OX=2320102 GN=D7X25_15315 PE=4 SV=1
MM1 pKa = 7.68KK2 pKa = 8.98KK3 pKa = 8.2TLASILAAFLSLSLVACGGGNSGNSAASGSNDD35 pKa = 3.29QGGGAASSAAGQASGEE51 pKa = 4.37STGKK55 pKa = 10.33KK56 pKa = 9.91VGIAMPTQDD65 pKa = 3.76LEE67 pKa = 3.77RR68 pKa = 11.84WNRR71 pKa = 11.84DD72 pKa = 2.54GAYY75 pKa = 10.41LDD77 pKa = 4.09EE78 pKa = 4.21QFKK81 pKa = 10.5AAGYY85 pKa = 6.46EE86 pKa = 4.25TVVTYY91 pKa = 11.22SNNKK95 pKa = 9.72AEE97 pKa = 4.08QQVNDD102 pKa = 4.09IQNMLAQGVDD112 pKa = 3.33ILVVAAIDD120 pKa = 4.02GEE122 pKa = 4.26ALNTVMNDD130 pKa = 2.91AGAEE134 pKa = 4.32GIPVIAYY141 pKa = 8.61DD142 pKa = 4.24RR143 pKa = 11.84LIMNDD148 pKa = 2.92NVSYY152 pKa = 10.79YY153 pKa = 11.19VSFDD157 pKa = 3.21NYY159 pKa = 10.76TVGTLQGQYY168 pKa = 10.65VINALDD174 pKa = 4.08LNNAAGPFNIEE185 pKa = 3.85FTAGDD190 pKa = 3.87PADD193 pKa = 3.87NNAGYY198 pKa = 9.9FFNGAMDD205 pKa = 3.89TLKK208 pKa = 10.8PFIDD212 pKa = 3.64SGKK215 pKa = 9.68LKK217 pKa = 10.54VVSGQTDD224 pKa = 4.33FNTVATEE231 pKa = 3.73QWQTDD236 pKa = 3.63VALDD240 pKa = 3.64RR241 pKa = 11.84AQNVLASYY249 pKa = 10.23YY250 pKa = 11.11ADD252 pKa = 3.51GTKK255 pKa = 10.4LDD257 pKa = 3.56VWVCSNDD264 pKa = 3.14STALGVAQAITSDD277 pKa = 3.85YY278 pKa = 11.46AGGNSVIMTGQDD290 pKa = 2.72GDD292 pKa = 3.9VANLRR297 pKa = 11.84NIKK300 pKa = 10.61DD301 pKa = 3.95GVQSMTVYY309 pKa = 10.58KK310 pKa = 10.62AVANEE315 pKa = 3.97AVVTLDD321 pKa = 3.57LVKK324 pKa = 10.82AILDD328 pKa = 3.69GSTVDD333 pKa = 3.48NSLITGSNWGFEE345 pKa = 4.39CAYY348 pKa = 9.07DD349 pKa = 3.56TSSYY353 pKa = 8.79FTSEE357 pKa = 3.64GHH359 pKa = 5.84NCPSFLLVPDD369 pKa = 5.01VITADD374 pKa = 3.36NMEE377 pKa = 4.69EE378 pKa = 4.19KK379 pKa = 10.55LVTPGYY385 pKa = 9.92YY386 pKa = 9.78KK387 pKa = 10.79VGADD391 pKa = 3.95GYY393 pKa = 11.58LEE395 pKa = 4.22ATNGG399 pKa = 3.41
MM1 pKa = 7.68KK2 pKa = 8.98KK3 pKa = 8.2TLASILAAFLSLSLVACGGGNSGNSAASGSNDD35 pKa = 3.29QGGGAASSAAGQASGEE51 pKa = 4.37STGKK55 pKa = 10.33KK56 pKa = 9.91VGIAMPTQDD65 pKa = 3.76LEE67 pKa = 3.77RR68 pKa = 11.84WNRR71 pKa = 11.84DD72 pKa = 2.54GAYY75 pKa = 10.41LDD77 pKa = 4.09EE78 pKa = 4.21QFKK81 pKa = 10.5AAGYY85 pKa = 6.46EE86 pKa = 4.25TVVTYY91 pKa = 11.22SNNKK95 pKa = 9.72AEE97 pKa = 4.08QQVNDD102 pKa = 4.09IQNMLAQGVDD112 pKa = 3.33ILVVAAIDD120 pKa = 4.02GEE122 pKa = 4.26ALNTVMNDD130 pKa = 2.91AGAEE134 pKa = 4.32GIPVIAYY141 pKa = 8.61DD142 pKa = 4.24RR143 pKa = 11.84LIMNDD148 pKa = 2.92NVSYY152 pKa = 10.79YY153 pKa = 11.19VSFDD157 pKa = 3.21NYY159 pKa = 10.76TVGTLQGQYY168 pKa = 10.65VINALDD174 pKa = 4.08LNNAAGPFNIEE185 pKa = 3.85FTAGDD190 pKa = 3.87PADD193 pKa = 3.87NNAGYY198 pKa = 9.9FFNGAMDD205 pKa = 3.89TLKK208 pKa = 10.8PFIDD212 pKa = 3.64SGKK215 pKa = 9.68LKK217 pKa = 10.54VVSGQTDD224 pKa = 4.33FNTVATEE231 pKa = 3.73QWQTDD236 pKa = 3.63VALDD240 pKa = 3.64RR241 pKa = 11.84AQNVLASYY249 pKa = 10.23YY250 pKa = 11.11ADD252 pKa = 3.51GTKK255 pKa = 10.4LDD257 pKa = 3.56VWVCSNDD264 pKa = 3.14STALGVAQAITSDD277 pKa = 3.85YY278 pKa = 11.46AGGNSVIMTGQDD290 pKa = 2.72GDD292 pKa = 3.9VANLRR297 pKa = 11.84NIKK300 pKa = 10.61DD301 pKa = 3.95GVQSMTVYY309 pKa = 10.58KK310 pKa = 10.62AVANEE315 pKa = 3.97AVVTLDD321 pKa = 3.57LVKK324 pKa = 10.82AILDD328 pKa = 3.69GSTVDD333 pKa = 3.48NSLITGSNWGFEE345 pKa = 4.39CAYY348 pKa = 9.07DD349 pKa = 3.56TSSYY353 pKa = 8.79FTSEE357 pKa = 3.64GHH359 pKa = 5.84NCPSFLLVPDD369 pKa = 5.01VITADD374 pKa = 3.36NMEE377 pKa = 4.69EE378 pKa = 4.19KK379 pKa = 10.55LVTPGYY385 pKa = 9.92YY386 pKa = 9.78KK387 pKa = 10.79VGADD391 pKa = 3.95GYY393 pKa = 11.58LEE395 pKa = 4.22ATNGG399 pKa = 3.41
Molecular weight: 41.92 kDa
Isoelectric point according different methods:
Protein with the highest isoelectric point:
>tr|A0A3A9FPV7|A0A3A9FPV7_9BACT ABC transporter ATP-binding protein OS=bacterium 1XD42-8 OX=2320102 GN=D7X25_20675 PE=4 SV=1
MM1 pKa = 7.6KK2 pKa = 8.55MTYY5 pKa = 8.37QPKK8 pKa = 8.44RR9 pKa = 11.84RR10 pKa = 11.84KK11 pKa = 8.51RR12 pKa = 11.84AKK14 pKa = 8.81VHH16 pKa = 5.44GFRR19 pKa = 11.84ARR21 pKa = 11.84MSSKK25 pKa = 9.99GGRR28 pKa = 11.84RR29 pKa = 11.84VLAARR34 pKa = 11.84RR35 pKa = 11.84AKK37 pKa = 9.92GRR39 pKa = 11.84KK40 pKa = 8.91RR41 pKa = 11.84LSAA44 pKa = 3.96
MM1 pKa = 7.6KK2 pKa = 8.55MTYY5 pKa = 8.37QPKK8 pKa = 8.44RR9 pKa = 11.84RR10 pKa = 11.84KK11 pKa = 8.51RR12 pKa = 11.84AKK14 pKa = 8.81VHH16 pKa = 5.44GFRR19 pKa = 11.84ARR21 pKa = 11.84MSSKK25 pKa = 9.99GGRR28 pKa = 11.84RR29 pKa = 11.84VLAARR34 pKa = 11.84RR35 pKa = 11.84AKK37 pKa = 9.92GRR39 pKa = 11.84KK40 pKa = 8.91RR41 pKa = 11.84LSAA44 pKa = 3.96
Molecular weight: 5.14 kDa
Isoelectric point according different methods:
Peptides (in silico digests for buttom-up proteomics)
Below you can find in silico digests of the whole proteome with Trypsin, Chymotrypsin, Trypsin+LysC, LysN, ArgC proteases suitable for different mass spec machines.| Try ESI |
 |
|---|
| ChTry ESI |
 |
|---|
| ArgC ESI |
 |
|---|
| LysN ESI |
 |
|---|
| TryLysC ESI |
 |
|---|
| Try MALDI |
 |
|---|
| ChTry MALDI |
 |
|---|
| ArgC MALDI |
 |
|---|
| LysN MALDI |
 |
|---|
| TryLysC MALDI |
 |
|---|
| Try LTQ |
 |
|---|
| ChTry LTQ |
 |
|---|
| ArgC LTQ |
 |
|---|
| LysN LTQ |
 |
|---|
| TryLysC LTQ |
 |
|---|
| Try MSlow |
 |
|---|
| ChTry MSlow |
 |
|---|
| ArgC MSlow |
 |
|---|
| LysN MSlow |
 |
|---|
| TryLysC MSlow |
 |
|---|
| Try MShigh |
 |
|---|
| ChTry MShigh |
 |
|---|
| ArgC MShigh |
 |
|---|
| LysN MShigh |
 |
|---|
| TryLysC MShigh |
 |
|---|
General Statistics
Number of major isoforms |
Number of additional isoforms |
Number of all proteins |
Number of amino acids |
Min. Seq. Length |
Max. Seq. Length |
Avg. Seq. Length |
Avg. Mol. Weight |
|---|---|---|---|---|---|---|---|
0 |
1928657 |
17 |
2390 |
271.6 |
30.56 |
Amino acid frequency
Ala |
Cys |
Asp |
Glu |
Phe |
Gly |
His |
Ile |
Lys |
Leu |
|---|---|---|---|---|---|---|---|---|---|
7.245 ± 0.036 | 1.515 ± 0.015 |
5.104 ± 0.022 | 7.729 ± 0.032 |
4.354 ± 0.026 | 7.143 ± 0.031 |
1.805 ± 0.011 | 7.485 ± 0.033 |
7.019 ± 0.034 | 9.338 ± 0.031 |
Met |
Asn |
Gln |
Pro |
Arg |
Ser |
Thr |
Val |
Trp |
Tyr |
|---|---|---|---|---|---|---|---|---|---|
3.004 ± 0.015 | 4.216 ± 0.024 |
3.606 ± 0.026 | 3.613 ± 0.02 |
4.579 ± 0.023 | 5.952 ± 0.023 |
5.036 ± 0.022 | 6.262 ± 0.021 |
0.958 ± 0.01 | 4.039 ± 0.021 |
Most of the basic statistics you can see at this page can be downloaded from this CSV file
Proteome-pI is available under Creative Commons Attribution-NoDerivs license, for more details see here
| Reference: Kozlowski LP. Proteome-pI 2.0: Proteome Isoelectric Point Database Update. Nucleic Acids Res. 2021, doi: 10.1093/nar/gkab944 | Contact: Lukasz P. Kozlowski |
