Lentibacillus sp. JNUCC-1
Taxonomy: cellular organisms; Bacteria; Terrabacteria group; Firmicutes; Bacilli; Bacillales; Bacillaceae; Lentibacillus; unclassified Lentibacillus
Average proteome isoelectric point is 6.17
Get precalculated fractions of proteins

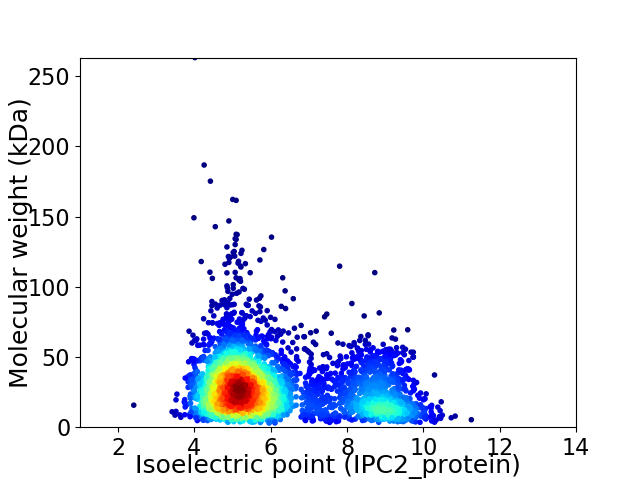
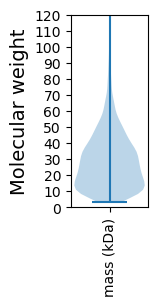
Virtual 2D-PAGE plot for 3784 proteins (isoelectric point calculated using IPC2_protein)
Get csv file with sequences according to given criteria:
* You can choose from 21 different methods for calculating isoelectric point
Summary statistics related to proteome-wise predictions


Protein with the lowest isoelectric point:
>tr|A0A6N8HR42|A0A6N8HR42_9BACI HTH cro/C1-type domain-containing protein OS=Lentibacillus sp. JNUCC-1 OX=2654513 GN=JNUCC1_02648 PE=4 SV=1
MM1 pKa = 7.65NDD3 pKa = 3.52QIKK6 pKa = 10.55LLIGMVVVIVIPALLAWFIFHH27 pKa = 5.75QQEE30 pKa = 4.43KK31 pKa = 10.45EE32 pKa = 4.07DD33 pKa = 4.36DD34 pKa = 3.57TSQPDD39 pKa = 3.73SKK41 pKa = 11.57SEE43 pKa = 3.89ILWGVDD49 pKa = 2.69SATQADD55 pKa = 3.6QDD57 pKa = 3.91MYY59 pKa = 11.52QCVNSNYY66 pKa = 7.58GTPAVWGRR74 pKa = 11.84YY75 pKa = 9.28LGDD78 pKa = 3.52IEE80 pKa = 4.58NVSDD84 pKa = 5.26ALTKK88 pKa = 10.86DD89 pKa = 3.2EE90 pKa = 5.11AAFLHH95 pKa = 6.36EE96 pKa = 5.3KK97 pKa = 10.32DD98 pKa = 3.65VQILVIYY105 pKa = 10.19NLIEE109 pKa = 4.5DD110 pKa = 3.63ATGYY114 pKa = 10.94EE115 pKa = 4.03NGAAHH120 pKa = 7.19AEE122 pKa = 4.27SAIDD126 pKa = 3.63AANEE130 pKa = 3.66LDD132 pKa = 3.59IPEE135 pKa = 4.5GVALFADD142 pKa = 4.28IEE144 pKa = 4.88PIFPVDD150 pKa = 3.41TAFLEE155 pKa = 4.25SWYY158 pKa = 9.13DD159 pKa = 3.53TLKK162 pKa = 11.04NSAYY166 pKa = 9.5EE167 pKa = 3.86PGVYY171 pKa = 10.28GVFDD175 pKa = 4.23EE176 pKa = 5.59GSDD179 pKa = 3.25ILSSYY184 pKa = 11.72NEE186 pKa = 4.25MEE188 pKa = 4.81PSRR191 pKa = 11.84QQDD194 pKa = 3.83TVVWTAFPQQDD205 pKa = 2.77ITTKK209 pKa = 10.71EE210 pKa = 3.84NAPDD214 pKa = 3.71YY215 pKa = 10.56AAQGPDD221 pKa = 3.0QAKK224 pKa = 10.27VYY226 pKa = 8.94GWQYY230 pKa = 11.26AIDD233 pKa = 4.9GEE235 pKa = 4.78TCTIDD240 pKa = 3.2TNLFKK245 pKa = 10.98PEE247 pKa = 3.57MRR249 pKa = 11.84RR250 pKa = 11.84YY251 pKa = 9.57LWW253 pKa = 3.56
MM1 pKa = 7.65NDD3 pKa = 3.52QIKK6 pKa = 10.55LLIGMVVVIVIPALLAWFIFHH27 pKa = 5.75QQEE30 pKa = 4.43KK31 pKa = 10.45EE32 pKa = 4.07DD33 pKa = 4.36DD34 pKa = 3.57TSQPDD39 pKa = 3.73SKK41 pKa = 11.57SEE43 pKa = 3.89ILWGVDD49 pKa = 2.69SATQADD55 pKa = 3.6QDD57 pKa = 3.91MYY59 pKa = 11.52QCVNSNYY66 pKa = 7.58GTPAVWGRR74 pKa = 11.84YY75 pKa = 9.28LGDD78 pKa = 3.52IEE80 pKa = 4.58NVSDD84 pKa = 5.26ALTKK88 pKa = 10.86DD89 pKa = 3.2EE90 pKa = 5.11AAFLHH95 pKa = 6.36EE96 pKa = 5.3KK97 pKa = 10.32DD98 pKa = 3.65VQILVIYY105 pKa = 10.19NLIEE109 pKa = 4.5DD110 pKa = 3.63ATGYY114 pKa = 10.94EE115 pKa = 4.03NGAAHH120 pKa = 7.19AEE122 pKa = 4.27SAIDD126 pKa = 3.63AANEE130 pKa = 3.66LDD132 pKa = 3.59IPEE135 pKa = 4.5GVALFADD142 pKa = 4.28IEE144 pKa = 4.88PIFPVDD150 pKa = 3.41TAFLEE155 pKa = 4.25SWYY158 pKa = 9.13DD159 pKa = 3.53TLKK162 pKa = 11.04NSAYY166 pKa = 9.5EE167 pKa = 3.86PGVYY171 pKa = 10.28GVFDD175 pKa = 4.23EE176 pKa = 5.59GSDD179 pKa = 3.25ILSSYY184 pKa = 11.72NEE186 pKa = 4.25MEE188 pKa = 4.81PSRR191 pKa = 11.84QQDD194 pKa = 3.83TVVWTAFPQQDD205 pKa = 2.77ITTKK209 pKa = 10.71EE210 pKa = 3.84NAPDD214 pKa = 3.71YY215 pKa = 10.56AAQGPDD221 pKa = 3.0QAKK224 pKa = 10.27VYY226 pKa = 8.94GWQYY230 pKa = 11.26AIDD233 pKa = 4.9GEE235 pKa = 4.78TCTIDD240 pKa = 3.2TNLFKK245 pKa = 10.98PEE247 pKa = 3.57MRR249 pKa = 11.84RR250 pKa = 11.84YY251 pKa = 9.57LWW253 pKa = 3.56
Molecular weight: 28.39 kDa
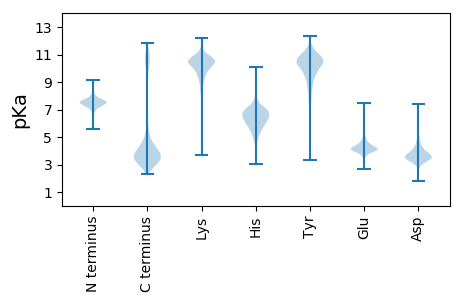
Isoelectric point according different methods:
Protein with the highest isoelectric point:
>tr|A0A6N8HNS8|A0A6N8HNS8_9BACI Serine acetyltransferase OS=Lentibacillus sp. JNUCC-1 OX=2654513 GN=JNUCC1_01885 PE=3 SV=1
MM1 pKa = 7.44KK2 pKa = 9.6RR3 pKa = 11.84TFQPNNRR10 pKa = 11.84KK11 pKa = 9.23RR12 pKa = 11.84KK13 pKa = 8.12KK14 pKa = 8.46VHH16 pKa = 5.5GFRR19 pKa = 11.84TRR21 pKa = 11.84MSTKK25 pKa = 10.06NGRR28 pKa = 11.84KK29 pKa = 8.49VLARR33 pKa = 11.84RR34 pKa = 11.84RR35 pKa = 11.84RR36 pKa = 11.84KK37 pKa = 9.05GRR39 pKa = 11.84KK40 pKa = 8.7VLSAA44 pKa = 4.05
MM1 pKa = 7.44KK2 pKa = 9.6RR3 pKa = 11.84TFQPNNRR10 pKa = 11.84KK11 pKa = 9.23RR12 pKa = 11.84KK13 pKa = 8.12KK14 pKa = 8.46VHH16 pKa = 5.5GFRR19 pKa = 11.84TRR21 pKa = 11.84MSTKK25 pKa = 10.06NGRR28 pKa = 11.84KK29 pKa = 8.49VLARR33 pKa = 11.84RR34 pKa = 11.84RR35 pKa = 11.84RR36 pKa = 11.84KK37 pKa = 9.05GRR39 pKa = 11.84KK40 pKa = 8.7VLSAA44 pKa = 4.05
Molecular weight: 5.34 kDa
Isoelectric point according different methods:
Peptides (in silico digests for buttom-up proteomics)
Below you can find in silico digests of the whole proteome with Trypsin, Chymotrypsin, Trypsin+LysC, LysN, ArgC proteases suitable for different mass spec machines.| Try ESI |
 |
|---|
| ChTry ESI |
 |
|---|
| ArgC ESI |
 |
|---|
| LysN ESI |
 |
|---|
| TryLysC ESI |
 |
|---|
| Try MALDI |
 |
|---|
| ChTry MALDI |
 |
|---|
| ArgC MALDI |
 |
|---|
| LysN MALDI |
 |
|---|
| TryLysC MALDI |
 |
|---|
| Try LTQ |
 |
|---|
| ChTry LTQ |
 |
|---|
| ArgC LTQ |
 |
|---|
| LysN LTQ |
 |
|---|
| TryLysC LTQ |
 |
|---|
| Try MSlow |
 |
|---|
| ChTry MSlow |
 |
|---|
| ArgC MSlow |
 |
|---|
| LysN MSlow |
 |
|---|
| TryLysC MSlow |
 |
|---|
| Try MShigh |
 |
|---|
| ChTry MShigh |
 |
|---|
| ArgC MShigh |
 |
|---|
| LysN MShigh |
 |
|---|
| TryLysC MShigh |
 |
|---|
General Statistics
Number of major isoforms |
Number of additional isoforms |
Number of all proteins |
Number of amino acids |
Min. Seq. Length |
Max. Seq. Length |
Avg. Seq. Length |
Avg. Mol. Weight |
|---|---|---|---|---|---|---|---|
0 |
1022484 |
29 |
2364 |
270.2 |
30.31 |
Amino acid frequency
Ala |
Cys |
Asp |
Glu |
Phe |
Gly |
His |
Ile |
Lys |
Leu |
|---|---|---|---|---|---|---|---|---|---|
7.517 ± 0.044 | 0.65 ± 0.014 |
5.798 ± 0.037 | 7.252 ± 0.049 |
4.368 ± 0.029 | 6.906 ± 0.043 |
2.403 ± 0.021 | 7.316 ± 0.038 |
6.258 ± 0.042 | 9.461 ± 0.046 |
Met |
Asn |
Gln |
Pro |
Arg |
Ser |
Thr |
Val |
Trp |
Tyr |
|---|---|---|---|---|---|---|---|---|---|
3.049 ± 0.022 | 4.149 ± 0.025 |
3.694 ± 0.027 | 3.954 ± 0.03 |
4.252 ± 0.032 | 5.671 ± 0.027 |
5.689 ± 0.028 | 7.084 ± 0.035 |
1.05 ± 0.015 | 3.479 ± 0.024 |
Most of the basic statistics you can see at this page can be downloaded from this CSV file
Proteome-pI is available under Creative Commons Attribution-NoDerivs license, for more details see here
| Reference: Kozlowski LP. Proteome-pI 2.0: Proteome Isoelectric Point Database Update. Nucleic Acids Res. 2021, doi: 10.1093/nar/gkab944 | Contact: Lukasz P. Kozlowski |
