Loktanella fryxellensis
Taxonomy: cellular organisms; Bacteria; Proteobacteria; Alphaproteobacteria; Rhodobacterales; Roseobacteraceae; Loktanella
Average proteome isoelectric point is 6.3
Get precalculated fractions of proteins

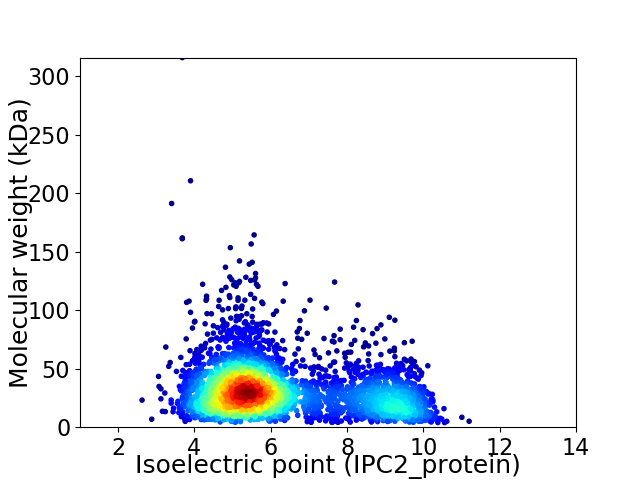
Virtual 2D-PAGE plot for 3431 proteins (isoelectric point calculated using IPC2_protein)
Get csv file with sequences according to given criteria:
* You can choose from 21 different methods for calculating isoelectric point
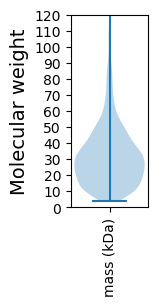
Summary statistics related to proteome-wise predictions


Protein with the lowest isoelectric point:
>tr|A0A1H8J473|A0A1H8J473_9RHOB D-3-phosphoglycerate dehydrogenase OS=Loktanella fryxellensis OX=245187 GN=SAMN04488003_13217 PE=3 SV=1
MM1 pKa = 7.11NVKK4 pKa = 10.33ALLLCLLPLSASAQGFAGLGGDD26 pKa = 3.91ADD28 pKa = 4.4GFSIPQPDD36 pKa = 3.81PQFSFPADD44 pKa = 3.36HH45 pKa = 6.8GAHH48 pKa = 6.58PDD50 pKa = 3.49YY51 pKa = 10.7RR52 pKa = 11.84IEE54 pKa = 3.67WWYY57 pKa = 8.76VTANLTGPDD66 pKa = 3.64GTPYY70 pKa = 10.84GLQWTLFRR78 pKa = 11.84SALAPQTQEE87 pKa = 3.95GWDD90 pKa = 4.32DD91 pKa = 3.46PQLWMGHH98 pKa = 5.77AAVTTPDD105 pKa = 2.74AHH107 pKa = 6.27YY108 pKa = 10.36VAEE111 pKa = 4.12RR112 pKa = 11.84LARR115 pKa = 11.84GGIGQAGVTATPFSAWIDD133 pKa = 3.18DD134 pKa = 3.75WLFDD138 pKa = 5.16GIDD141 pKa = 3.65SGTLRR146 pKa = 11.84ATGADD151 pKa = 3.52FAYY154 pKa = 10.69DD155 pKa = 3.66MQLTAQGPLVAQGIDD170 pKa = 3.49GYY172 pKa = 8.65SVKK175 pKa = 10.46SASGQASYY183 pKa = 11.19YY184 pKa = 9.62YY185 pKa = 9.9SQPFYY190 pKa = 10.85EE191 pKa = 4.56VAGTLTLPDD200 pKa = 3.68GPVAVTGTAWLDD212 pKa = 3.93RR213 pKa = 11.84EE214 pKa = 4.47WSSQPLADD222 pKa = 5.05NQTGWDD228 pKa = 3.47WFSLNFDD235 pKa = 3.87DD236 pKa = 5.62GARR239 pKa = 11.84MMGFRR244 pKa = 11.84LRR246 pKa = 11.84QTDD249 pKa = 3.79GEE251 pKa = 4.71NYY253 pKa = 9.89TSATWIAPDD262 pKa = 3.91GTPTPYY268 pKa = 11.12ADD270 pKa = 3.96GALTATPLEE279 pKa = 4.34EE280 pKa = 4.31SQVGPRR286 pKa = 11.84TVPTTWRR293 pKa = 11.84VEE295 pKa = 4.05LPAQGVDD302 pKa = 3.33VTVAAVNTQAWMDD315 pKa = 3.43TSVPYY320 pKa = 10.09WEE322 pKa = 5.25GPVTIDD328 pKa = 3.28GTRR331 pKa = 11.84SGVGYY336 pKa = 11.02LEE338 pKa = 4.05MTGYY342 pKa = 9.98EE343 pKa = 4.04
MM1 pKa = 7.11NVKK4 pKa = 10.33ALLLCLLPLSASAQGFAGLGGDD26 pKa = 3.91ADD28 pKa = 4.4GFSIPQPDD36 pKa = 3.81PQFSFPADD44 pKa = 3.36HH45 pKa = 6.8GAHH48 pKa = 6.58PDD50 pKa = 3.49YY51 pKa = 10.7RR52 pKa = 11.84IEE54 pKa = 3.67WWYY57 pKa = 8.76VTANLTGPDD66 pKa = 3.64GTPYY70 pKa = 10.84GLQWTLFRR78 pKa = 11.84SALAPQTQEE87 pKa = 3.95GWDD90 pKa = 4.32DD91 pKa = 3.46PQLWMGHH98 pKa = 5.77AAVTTPDD105 pKa = 2.74AHH107 pKa = 6.27YY108 pKa = 10.36VAEE111 pKa = 4.12RR112 pKa = 11.84LARR115 pKa = 11.84GGIGQAGVTATPFSAWIDD133 pKa = 3.18DD134 pKa = 3.75WLFDD138 pKa = 5.16GIDD141 pKa = 3.65SGTLRR146 pKa = 11.84ATGADD151 pKa = 3.52FAYY154 pKa = 10.69DD155 pKa = 3.66MQLTAQGPLVAQGIDD170 pKa = 3.49GYY172 pKa = 8.65SVKK175 pKa = 10.46SASGQASYY183 pKa = 11.19YY184 pKa = 9.62YY185 pKa = 9.9SQPFYY190 pKa = 10.85EE191 pKa = 4.56VAGTLTLPDD200 pKa = 3.68GPVAVTGTAWLDD212 pKa = 3.93RR213 pKa = 11.84EE214 pKa = 4.47WSSQPLADD222 pKa = 5.05NQTGWDD228 pKa = 3.47WFSLNFDD235 pKa = 3.87DD236 pKa = 5.62GARR239 pKa = 11.84MMGFRR244 pKa = 11.84LRR246 pKa = 11.84QTDD249 pKa = 3.79GEE251 pKa = 4.71NYY253 pKa = 9.89TSATWIAPDD262 pKa = 3.91GTPTPYY268 pKa = 11.12ADD270 pKa = 3.96GALTATPLEE279 pKa = 4.34EE280 pKa = 4.31SQVGPRR286 pKa = 11.84TVPTTWRR293 pKa = 11.84VEE295 pKa = 4.05LPAQGVDD302 pKa = 3.33VTVAAVNTQAWMDD315 pKa = 3.43TSVPYY320 pKa = 10.09WEE322 pKa = 5.25GPVTIDD328 pKa = 3.28GTRR331 pKa = 11.84SGVGYY336 pKa = 11.02LEE338 pKa = 4.05MTGYY342 pKa = 9.98EE343 pKa = 4.04
Molecular weight: 37.02 kDa
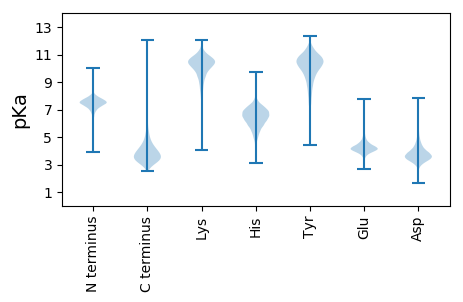
Isoelectric point according different methods:
Protein with the highest isoelectric point:
>tr|A0A1H8AAS4|A0A1H8AAS4_9RHOB L-lactate dehydrogenase (Cytochrome) OS=Loktanella fryxellensis OX=245187 GN=SAMN04488003_10395 PE=3 SV=1
MM1 pKa = 7.45KK2 pKa = 9.61RR3 pKa = 11.84TFQPSNRR10 pKa = 11.84VRR12 pKa = 11.84KK13 pKa = 8.99NRR15 pKa = 11.84HH16 pKa = 3.77GFRR19 pKa = 11.84ARR21 pKa = 11.84MATPSGRR28 pKa = 11.84KK29 pKa = 8.93IINARR34 pKa = 11.84RR35 pKa = 11.84AKK37 pKa = 10.31GRR39 pKa = 11.84AKK41 pKa = 10.69LSAA44 pKa = 3.92
MM1 pKa = 7.45KK2 pKa = 9.61RR3 pKa = 11.84TFQPSNRR10 pKa = 11.84VRR12 pKa = 11.84KK13 pKa = 8.99NRR15 pKa = 11.84HH16 pKa = 3.77GFRR19 pKa = 11.84ARR21 pKa = 11.84MATPSGRR28 pKa = 11.84KK29 pKa = 8.93IINARR34 pKa = 11.84RR35 pKa = 11.84AKK37 pKa = 10.31GRR39 pKa = 11.84AKK41 pKa = 10.69LSAA44 pKa = 3.92
Molecular weight: 5.08 kDa
Isoelectric point according different methods:
Peptides (in silico digests for buttom-up proteomics)
Below you can find in silico digests of the whole proteome with Trypsin, Chymotrypsin, Trypsin+LysC, LysN, ArgC proteases suitable for different mass spec machines.| Try ESI |
 |
|---|
| ChTry ESI |
 |
|---|
| ArgC ESI |
 |
|---|
| LysN ESI |
 |
|---|
| TryLysC ESI |
 |
|---|
| Try MALDI |
 |
|---|
| ChTry MALDI |
 |
|---|
| ArgC MALDI |
 |
|---|
| LysN MALDI |
 |
|---|
| TryLysC MALDI |
 |
|---|
| Try LTQ |
 |
|---|
| ChTry LTQ |
 |
|---|
| ArgC LTQ |
 |
|---|
| LysN LTQ |
 |
|---|
| TryLysC LTQ |
 |
|---|
| Try MSlow |
 |
|---|
| ChTry MSlow |
 |
|---|
| ArgC MSlow |
 |
|---|
| LysN MSlow |
 |
|---|
| TryLysC MSlow |
 |
|---|
| Try MShigh |
 |
|---|
| ChTry MShigh |
 |
|---|
| ArgC MShigh |
 |
|---|
| LysN MShigh |
 |
|---|
| TryLysC MShigh |
 |
|---|
General Statistics
Number of major isoforms |
Number of additional isoforms |
Number of all proteins |
Number of amino acids |
Min. Seq. Length |
Max. Seq. Length |
Avg. Seq. Length |
Avg. Mol. Weight |
|---|---|---|---|---|---|---|---|
0 |
1062454 |
39 |
3119 |
309.7 |
33.25 |
Amino acid frequency
Ala |
Cys |
Asp |
Glu |
Phe |
Gly |
His |
Ile |
Lys |
Leu |
|---|---|---|---|---|---|---|---|---|---|
13.716 ± 0.073 | 0.849 ± 0.013 |
6.787 ± 0.046 | 4.288 ± 0.039 |
3.417 ± 0.028 | 8.901 ± 0.058 |
2.107 ± 0.023 | 4.955 ± 0.03 |
2.292 ± 0.034 | 10.038 ± 0.054 |
Met |
Asn |
Gln |
Pro |
Arg |
Ser |
Thr |
Val |
Trp |
Tyr |
|---|---|---|---|---|---|---|---|---|---|
2.794 ± 0.023 | 2.288 ± 0.029 |
5.301 ± 0.035 | 3.307 ± 0.021 |
6.958 ± 0.043 | 4.508 ± 0.028 |
6.32 ± 0.047 | 7.739 ± 0.037 |
1.387 ± 0.021 | 2.048 ± 0.025 |
Most of the basic statistics you can see at this page can be downloaded from this CSV file
Proteome-pI is available under Creative Commons Attribution-NoDerivs license, for more details see here
| Reference: Kozlowski LP. Proteome-pI 2.0: Proteome Isoelectric Point Database Update. Nucleic Acids Res. 2021, doi: 10.1093/nar/gkab944 | Contact: Lukasz P. Kozlowski |
