Halonotius sp. F13-13
Taxonomy: cellular organisms; Archaea; Euryarchaeota; Stenosarchaea group; Halobacteria; Haloferacales; Halorubraceae; Halonotius; unclassified Halonotius
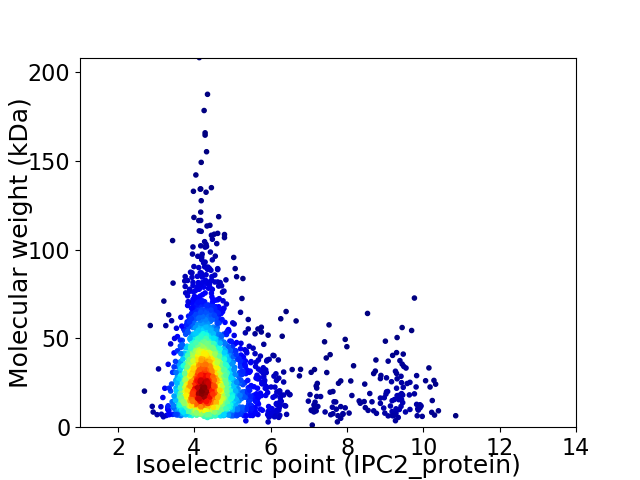
Average proteome isoelectric point is 4.75
Get precalculated fractions of proteins

Virtual 2D-PAGE plot for 2460 proteins (isoelectric point calculated using IPC2_protein)
Get csv file with sequences according to given criteria:
* You can choose from 21 different methods for calculating isoelectric point
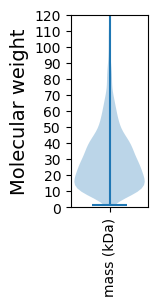
Summary statistics related to proteome-wise predictions


Protein with the lowest isoelectric point:
>tr|A0A3A6PSN4|A0A3A6PSN4_9EURY Uncharacterized protein OS=Halonotius sp. F13-13 OX=2216978 GN=DM826_12615 PE=4 SV=1
MM1 pKa = 7.46TISDD5 pKa = 3.67RR6 pKa = 11.84VVFDD10 pKa = 4.21AEE12 pKa = 4.24PLVAHH17 pKa = 7.24ADD19 pKa = 3.81DD20 pKa = 4.57EE21 pKa = 5.0PGSEE25 pKa = 4.22VVEE28 pKa = 5.02DD29 pKa = 3.94YY30 pKa = 11.47LDD32 pKa = 3.96AVAADD37 pKa = 3.91DD38 pKa = 3.71TTGYY42 pKa = 10.45VSYY45 pKa = 9.83VTLTEE50 pKa = 3.51VRR52 pKa = 11.84YY53 pKa = 9.89ILSQKK58 pKa = 9.24YY59 pKa = 10.12DD60 pKa = 3.1RR61 pKa = 11.84GTADD65 pKa = 5.12EE66 pKa = 4.7YY67 pKa = 11.07IDD69 pKa = 3.58WLTDD73 pKa = 3.49LGIEE77 pKa = 4.14PVGVADD83 pKa = 4.54CWQGTADD90 pKa = 4.44HH91 pKa = 6.37VLSHH95 pKa = 6.42NPALGDD101 pKa = 3.66AFALATADD109 pKa = 4.28HH110 pKa = 7.21LDD112 pKa = 3.28ATLLVGADD120 pKa = 3.96DD121 pKa = 6.2DD122 pKa = 4.64YY123 pKa = 12.06DD124 pKa = 4.16AVDD127 pKa = 4.23DD128 pKa = 4.23VSITRR133 pKa = 11.84FRR135 pKa = 11.84NEE137 pKa = 3.42AGG139 pKa = 3.28
MM1 pKa = 7.46TISDD5 pKa = 3.67RR6 pKa = 11.84VVFDD10 pKa = 4.21AEE12 pKa = 4.24PLVAHH17 pKa = 7.24ADD19 pKa = 3.81DD20 pKa = 4.57EE21 pKa = 5.0PGSEE25 pKa = 4.22VVEE28 pKa = 5.02DD29 pKa = 3.94YY30 pKa = 11.47LDD32 pKa = 3.96AVAADD37 pKa = 3.91DD38 pKa = 3.71TTGYY42 pKa = 10.45VSYY45 pKa = 9.83VTLTEE50 pKa = 3.51VRR52 pKa = 11.84YY53 pKa = 9.89ILSQKK58 pKa = 9.24YY59 pKa = 10.12DD60 pKa = 3.1RR61 pKa = 11.84GTADD65 pKa = 5.12EE66 pKa = 4.7YY67 pKa = 11.07IDD69 pKa = 3.58WLTDD73 pKa = 3.49LGIEE77 pKa = 4.14PVGVADD83 pKa = 4.54CWQGTADD90 pKa = 4.44HH91 pKa = 6.37VLSHH95 pKa = 6.42NPALGDD101 pKa = 3.66AFALATADD109 pKa = 4.28HH110 pKa = 7.21LDD112 pKa = 3.28ATLLVGADD120 pKa = 3.96DD121 pKa = 6.2DD122 pKa = 4.64YY123 pKa = 12.06DD124 pKa = 4.16AVDD127 pKa = 4.23DD128 pKa = 4.23VSITRR133 pKa = 11.84FRR135 pKa = 11.84NEE137 pKa = 3.42AGG139 pKa = 3.28
Molecular weight: 15.06 kDa
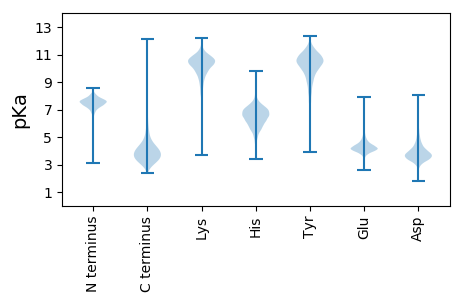
Isoelectric point according different methods:
Protein with the highest isoelectric point:
>tr|A0A3A6PUN0|A0A3A6PUN0_9EURY Uncharacterized protein OS=Halonotius sp. F13-13 OX=2216978 GN=DM826_10195 PE=4 SV=1
MM1 pKa = 7.22VVGLVVTAFWAMLPAYY17 pKa = 9.57VPNNAAVLAGGGRR30 pKa = 11.84PIDD33 pKa = 4.31GGRR36 pKa = 11.84TWGDD40 pKa = 2.84RR41 pKa = 11.84RR42 pKa = 11.84LLGDD46 pKa = 3.85GKK48 pKa = 7.53TWRR51 pKa = 11.84GTAVGTLVGITLAAGLNVAAAPLGSAIGFSLPTFPPAGALGLAAGAMAGDD101 pKa = 4.12IAASFVKK108 pKa = 10.14RR109 pKa = 11.84RR110 pKa = 11.84SGRR113 pKa = 11.84ARR115 pKa = 11.84GAAFPGLDD123 pKa = 3.01QLDD126 pKa = 4.07FVVGAILFAFVLAPGWAQATFTLGVLAVIVVVTPVLHH163 pKa = 6.23VGTNIIAYY171 pKa = 10.09LIGAKK176 pKa = 10.04NEE178 pKa = 3.87PWW180 pKa = 3.37
MM1 pKa = 7.22VVGLVVTAFWAMLPAYY17 pKa = 9.57VPNNAAVLAGGGRR30 pKa = 11.84PIDD33 pKa = 4.31GGRR36 pKa = 11.84TWGDD40 pKa = 2.84RR41 pKa = 11.84RR42 pKa = 11.84LLGDD46 pKa = 3.85GKK48 pKa = 7.53TWRR51 pKa = 11.84GTAVGTLVGITLAAGLNVAAAPLGSAIGFSLPTFPPAGALGLAAGAMAGDD101 pKa = 4.12IAASFVKK108 pKa = 10.14RR109 pKa = 11.84RR110 pKa = 11.84SGRR113 pKa = 11.84ARR115 pKa = 11.84GAAFPGLDD123 pKa = 3.01QLDD126 pKa = 4.07FVVGAILFAFVLAPGWAQATFTLGVLAVIVVVTPVLHH163 pKa = 6.23VGTNIIAYY171 pKa = 10.09LIGAKK176 pKa = 10.04NEE178 pKa = 3.87PWW180 pKa = 3.37
Molecular weight: 18.18 kDa
Isoelectric point according different methods:
Peptides (in silico digests for buttom-up proteomics)
Below you can find in silico digests of the whole proteome with Trypsin, Chymotrypsin, Trypsin+LysC, LysN, ArgC proteases suitable for different mass spec machines.| Try ESI |
 |
|---|
| ChTry ESI |
 |
|---|
| ArgC ESI |
 |
|---|
| LysN ESI |
 |
|---|
| TryLysC ESI |
 |
|---|
| Try MALDI |
 |
|---|
| ChTry MALDI |
 |
|---|
| ArgC MALDI |
 |
|---|
| LysN MALDI |
 |
|---|
| TryLysC MALDI |
 |
|---|
| Try LTQ |
 |
|---|
| ChTry LTQ |
 |
|---|
| ArgC LTQ |
 |
|---|
| LysN LTQ |
 |
|---|
| TryLysC LTQ |
 |
|---|
| Try MSlow |
 |
|---|
| ChTry MSlow |
 |
|---|
| ArgC MSlow |
 |
|---|
| LysN MSlow |
 |
|---|
| TryLysC MSlow |
 |
|---|
| Try MShigh |
 |
|---|
| ChTry MShigh |
 |
|---|
| ArgC MShigh |
 |
|---|
| LysN MShigh |
 |
|---|
| TryLysC MShigh |
 |
|---|
General Statistics
Number of major isoforms |
Number of additional isoforms |
Number of all proteins |
Number of amino acids |
Min. Seq. Length |
Max. Seq. Length |
Avg. Seq. Length |
Avg. Mol. Weight |
|---|---|---|---|---|---|---|---|
0 |
717023 |
10 |
1850 |
291.5 |
31.58 |
Amino acid frequency
Ala |
Cys |
Asp |
Glu |
Phe |
Gly |
His |
Ile |
Lys |
Leu |
|---|---|---|---|---|---|---|---|---|---|
11.184 ± 0.077 | 0.7 ± 0.015 |
8.847 ± 0.07 | 8.205 ± 0.07 |
3.177 ± 0.033 | 8.082 ± 0.053 |
1.956 ± 0.025 | 4.901 ± 0.043 |
1.937 ± 0.033 | 8.84 ± 0.052 |
Met |
Asn |
Gln |
Pro |
Arg |
Ser |
Thr |
Val |
Trp |
Tyr |
|---|---|---|---|---|---|---|---|---|---|
1.703 ± 0.022 | 2.472 ± 0.028 |
4.611 ± 0.033 | 2.921 ± 0.03 |
5.834 ± 0.039 | 5.549 ± 0.036 |
7.094 ± 0.042 | 8.352 ± 0.054 |
1.041 ± 0.018 | 2.595 ± 0.029 |
Most of the basic statistics you can see at this page can be downloaded from this CSV file
Proteome-pI is available under Creative Commons Attribution-NoDerivs license, for more details see here
| Reference: Kozlowski LP. Proteome-pI 2.0: Proteome Isoelectric Point Database Update. Nucleic Acids Res. 2021, doi: 10.1093/nar/gkab944 | Contact: Lukasz P. Kozlowski |
