Thermosipho atlanticus DSM 15807
Taxonomy: cellular organisms; Bacteria; Thermotogae; Thermotogae; Thermotogales; Fervidobacteriaceae; Thermosipho; Thermosipho atlanticus
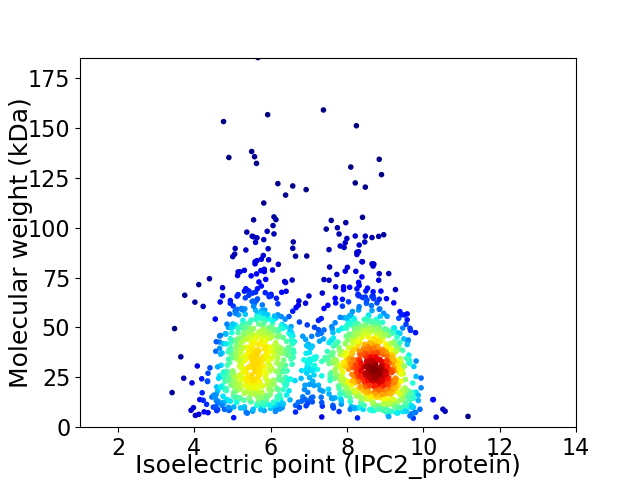
Average proteome isoelectric point is 7.14
Get precalculated fractions of proteins

Virtual 2D-PAGE plot for 1560 proteins (isoelectric point calculated using IPC2_protein)
Get csv file with sequences according to given criteria:
* You can choose from 21 different methods for calculating isoelectric point
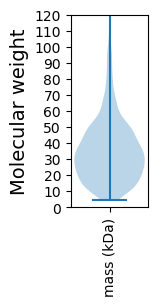
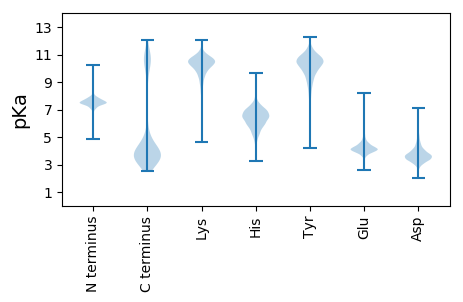
Summary statistics related to proteome-wise predictions


Protein with the lowest isoelectric point:
>tr|A0A1M5T4M1|A0A1M5T4M1_9BACT Fe-ADH domain-containing protein OS=Thermosipho atlanticus DSM 15807 OX=1123380 GN=SAMN02745199_1167 PE=4 SV=1
MM1 pKa = 7.36KK2 pKa = 10.45RR3 pKa = 11.84LFLILLFLLVLVFVLWSCGLQLPNSVTVSYY33 pKa = 11.03SNHH36 pKa = 5.84FEE38 pKa = 4.01FPLAMLHH45 pKa = 5.69FTLDD49 pKa = 3.57DD50 pKa = 4.76FINPVLLSLEE60 pKa = 4.13NEE62 pKa = 4.44GFQVTTGDD70 pKa = 4.46PITISFATTTTFIPGDD86 pKa = 3.95YY87 pKa = 9.77LPTGIPISGTEE98 pKa = 4.18TILDD102 pKa = 3.69QATLIQASTMQNGNVLQNVDD122 pKa = 4.14FNMSFEE128 pKa = 4.25VGYY131 pKa = 9.45FASTTTFDD139 pKa = 3.56STLVFYY145 pKa = 10.73INSTPVVISEE155 pKa = 4.2NSTEE159 pKa = 4.25SEE161 pKa = 4.06NLTKK165 pKa = 10.57YY166 pKa = 10.15VKK168 pKa = 10.19EE169 pKa = 4.08VLKK172 pKa = 10.83SGQDD176 pKa = 3.2LTVRR180 pKa = 11.84ADD182 pKa = 2.99IDD184 pKa = 3.37IDD186 pKa = 3.88GTIQSSDD193 pKa = 3.29EE194 pKa = 4.08LMLGVNWTFSLEE206 pKa = 4.1GTTLADD212 pKa = 3.06IVFDD216 pKa = 5.05ASTTDD221 pKa = 3.6LSVLEE226 pKa = 4.46SLTDD230 pKa = 4.0FVDD233 pKa = 3.24SATIVFDD240 pKa = 3.2EE241 pKa = 4.62WDD243 pKa = 3.44NSLGFDD249 pKa = 3.53TVFDD253 pKa = 3.79VGNLSFYY260 pKa = 10.88FGTTPPIVGLSKK272 pKa = 11.09DD273 pKa = 3.91DD274 pKa = 5.06LISIATDD281 pKa = 3.06NVPYY285 pKa = 10.16VIKK288 pKa = 10.9VPANSYY294 pKa = 10.64IKK296 pKa = 10.56LKK298 pKa = 10.7SNSYY302 pKa = 10.4LDD304 pKa = 3.5SAVYY308 pKa = 10.04ISLDD312 pKa = 3.34LTVATEE318 pKa = 4.09VTFF321 pKa = 4.26
MM1 pKa = 7.36KK2 pKa = 10.45RR3 pKa = 11.84LFLILLFLLVLVFVLWSCGLQLPNSVTVSYY33 pKa = 11.03SNHH36 pKa = 5.84FEE38 pKa = 4.01FPLAMLHH45 pKa = 5.69FTLDD49 pKa = 3.57DD50 pKa = 4.76FINPVLLSLEE60 pKa = 4.13NEE62 pKa = 4.44GFQVTTGDD70 pKa = 4.46PITISFATTTTFIPGDD86 pKa = 3.95YY87 pKa = 9.77LPTGIPISGTEE98 pKa = 4.18TILDD102 pKa = 3.69QATLIQASTMQNGNVLQNVDD122 pKa = 4.14FNMSFEE128 pKa = 4.25VGYY131 pKa = 9.45FASTTTFDD139 pKa = 3.56STLVFYY145 pKa = 10.73INSTPVVISEE155 pKa = 4.2NSTEE159 pKa = 4.25SEE161 pKa = 4.06NLTKK165 pKa = 10.57YY166 pKa = 10.15VKK168 pKa = 10.19EE169 pKa = 4.08VLKK172 pKa = 10.83SGQDD176 pKa = 3.2LTVRR180 pKa = 11.84ADD182 pKa = 2.99IDD184 pKa = 3.37IDD186 pKa = 3.88GTIQSSDD193 pKa = 3.29EE194 pKa = 4.08LMLGVNWTFSLEE206 pKa = 4.1GTTLADD212 pKa = 3.06IVFDD216 pKa = 5.05ASTTDD221 pKa = 3.6LSVLEE226 pKa = 4.46SLTDD230 pKa = 4.0FVDD233 pKa = 3.24SATIVFDD240 pKa = 3.2EE241 pKa = 4.62WDD243 pKa = 3.44NSLGFDD249 pKa = 3.53TVFDD253 pKa = 3.79VGNLSFYY260 pKa = 10.88FGTTPPIVGLSKK272 pKa = 11.09DD273 pKa = 3.91DD274 pKa = 5.06LISIATDD281 pKa = 3.06NVPYY285 pKa = 10.16VIKK288 pKa = 10.9VPANSYY294 pKa = 10.64IKK296 pKa = 10.56LKK298 pKa = 10.7SNSYY302 pKa = 10.4LDD304 pKa = 3.5SAVYY308 pKa = 10.04ISLDD312 pKa = 3.34LTVATEE318 pKa = 4.09VTFF321 pKa = 4.26
Molecular weight: 35.28 kDa
Isoelectric point according different methods:
Protein with the highest isoelectric point:
>tr|A0A1M5RC36|A0A1M5RC36_9BACT Adenine-specific DNA-methyltransferase OS=Thermosipho atlanticus DSM 15807 OX=1123380 GN=SAMN02745199_0462 PE=3 SV=1
MM1 pKa = 7.35KK2 pKa = 9.4RR3 pKa = 11.84TYY5 pKa = 9.91QPSRR9 pKa = 11.84IKK11 pKa = 10.52RR12 pKa = 11.84KK13 pKa = 8.24RR14 pKa = 11.84THH16 pKa = 6.29GFLARR21 pKa = 11.84KK22 pKa = 7.96RR23 pKa = 11.84TASGRR28 pKa = 11.84KK29 pKa = 7.3VLKK32 pKa = 9.48NRR34 pKa = 11.84RR35 pKa = 11.84RR36 pKa = 11.84KK37 pKa = 9.77GRR39 pKa = 11.84WRR41 pKa = 11.84LAVV44 pKa = 3.35
MM1 pKa = 7.35KK2 pKa = 9.4RR3 pKa = 11.84TYY5 pKa = 9.91QPSRR9 pKa = 11.84IKK11 pKa = 10.52RR12 pKa = 11.84KK13 pKa = 8.24RR14 pKa = 11.84THH16 pKa = 6.29GFLARR21 pKa = 11.84KK22 pKa = 7.96RR23 pKa = 11.84TASGRR28 pKa = 11.84KK29 pKa = 7.3VLKK32 pKa = 9.48NRR34 pKa = 11.84RR35 pKa = 11.84RR36 pKa = 11.84KK37 pKa = 9.77GRR39 pKa = 11.84WRR41 pKa = 11.84LAVV44 pKa = 3.35
Molecular weight: 5.41 kDa
Isoelectric point according different methods:
Peptides (in silico digests for buttom-up proteomics)
Below you can find in silico digests of the whole proteome with Trypsin, Chymotrypsin, Trypsin+LysC, LysN, ArgC proteases suitable for different mass spec machines.| Try ESI |
 |
|---|
| ChTry ESI |
 |
|---|
| ArgC ESI |
 |
|---|
| LysN ESI |
 |
|---|
| TryLysC ESI |
 |
|---|
| Try MALDI |
 |
|---|
| ChTry MALDI |
 |
|---|
| ArgC MALDI |
 |
|---|
| LysN MALDI |
 |
|---|
| TryLysC MALDI |
 |
|---|
| Try LTQ |
 |
|---|
| ChTry LTQ |
 |
|---|
| ArgC LTQ |
 |
|---|
| LysN LTQ |
 |
|---|
| TryLysC LTQ |
 |
|---|
| Try MSlow |
 |
|---|
| ChTry MSlow |
 |
|---|
| ArgC MSlow |
 |
|---|
| LysN MSlow |
 |
|---|
| TryLysC MSlow |
 |
|---|
| Try MShigh |
 |
|---|
| ChTry MShigh |
 |
|---|
| ArgC MShigh |
 |
|---|
| LysN MShigh |
 |
|---|
| TryLysC MShigh |
 |
|---|
General Statistics
Number of major isoforms |
Number of additional isoforms |
Number of all proteins |
Number of amino acids |
Min. Seq. Length |
Max. Seq. Length |
Avg. Seq. Length |
Avg. Mol. Weight |
|---|---|---|---|---|---|---|---|
0 |
501096 |
38 |
1650 |
321.2 |
36.58 |
Amino acid frequency
Ala |
Cys |
Asp |
Glu |
Phe |
Gly |
His |
Ile |
Lys |
Leu |
|---|---|---|---|---|---|---|---|---|---|
5.23 ± 0.058 | 0.6 ± 0.017 |
4.784 ± 0.044 | 7.625 ± 0.072 |
5.683 ± 0.071 | 6.405 ± 0.064 |
1.448 ± 0.024 | 9.956 ± 0.056 |
9.396 ± 0.064 | 9.688 ± 0.057 |
Met |
Asn |
Gln |
Pro |
Arg |
Ser |
Thr |
Val |
Trp |
Tyr |
|---|---|---|---|---|---|---|---|---|---|
2.152 ± 0.024 | 5.395 ± 0.051 |
3.442 ± 0.033 | 2.019 ± 0.022 |
3.632 ± 0.04 | 5.725 ± 0.048 |
4.673 ± 0.038 | 6.951 ± 0.056 |
0.877 ± 0.021 | 4.318 ± 0.045 |
Most of the basic statistics you can see at this page can be downloaded from this CSV file
Proteome-pI is available under Creative Commons Attribution-NoDerivs license, for more details see here
| Reference: Kozlowski LP. Proteome-pI 2.0: Proteome Isoelectric Point Database Update. Nucleic Acids Res. 2021, doi: 10.1093/nar/gkab944 | Contact: Lukasz P. Kozlowski |
