Photobacterium profundum (strain SS9)
Taxonomy: cellular organisms; Bacteria; Proteobacteria; Gammaproteobacteria; Vibrionales; Vibrionaceae; Photobacterium; Photobacterium profundum
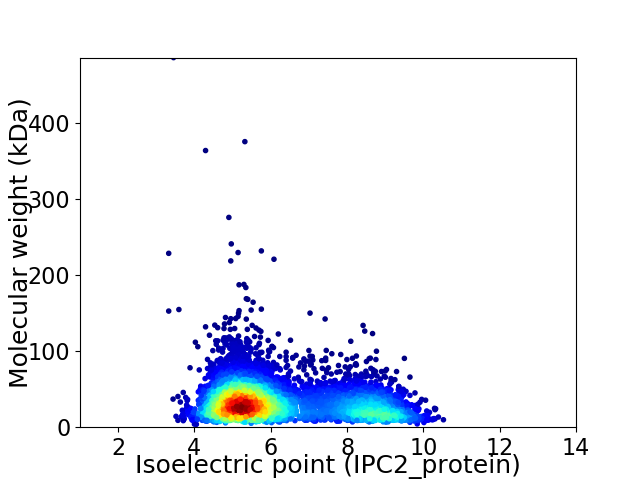
Average proteome isoelectric point is 6.29
Get precalculated fractions of proteins

Virtual 2D-PAGE plot for 5328 proteins (isoelectric point calculated using IPC2_protein)
Get csv file with sequences according to given criteria:
* You can choose from 21 different methods for calculating isoelectric point
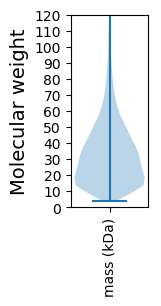
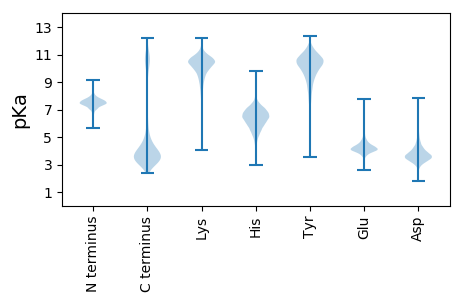
Summary statistics related to proteome-wise predictions


Protein with the lowest isoelectric point:
>tr|Q6LTP6|Q6LTP6_PHOPR Putative polar flagellar protein FlaK OS=Photobacterium profundum (strain SS9) OX=298386 GN=PSPTO195 PE=4 SV=1
MM1 pKa = 7.15LTASLVGCADD11 pKa = 3.46TPEE14 pKa = 4.19NQEE17 pKa = 4.23KK18 pKa = 8.53EE19 pKa = 4.59TVPTNVAEE27 pKa = 4.24QINAEE32 pKa = 4.13EE33 pKa = 4.3FEE35 pKa = 4.71SVNDD39 pKa = 3.55VYY41 pKa = 11.68DD42 pKa = 3.89PLEE45 pKa = 4.16GFNRR49 pKa = 11.84VMWDD53 pKa = 3.28LNYY56 pKa = 10.98DD57 pKa = 3.65YY58 pKa = 10.95LDD60 pKa = 4.58PYY62 pKa = 10.23LARR65 pKa = 11.84PISLAYY71 pKa = 10.11VDD73 pKa = 4.12YY74 pKa = 10.21TPNPVRR80 pKa = 11.84LGIANFFANLDD91 pKa = 3.81EE92 pKa = 4.67PASMVNSLIMQNPEE106 pKa = 3.39DD107 pKa = 4.02AVAHH111 pKa = 6.5FNRR114 pKa = 11.84FWINTVFGIAGLIDD128 pKa = 3.29IASAADD134 pKa = 3.62IPPPSNRR141 pKa = 11.84AFGDD145 pKa = 3.38SLGYY149 pKa = 10.42YY150 pKa = 10.16GVGNGPYY157 pKa = 10.43FMVPFYY163 pKa = 11.43GPVTLRR169 pKa = 11.84EE170 pKa = 4.32GVGDD174 pKa = 3.95AADD177 pKa = 3.91GLYY180 pKa = 10.87LPLSLLTFWQSLGKK194 pKa = 9.01WAFEE198 pKa = 3.91GMEE201 pKa = 4.21DD202 pKa = 3.66RR203 pKa = 11.84AALVKK208 pKa = 10.53QEE210 pKa = 4.68ALLEE214 pKa = 4.53DD215 pKa = 4.01SPDD218 pKa = 3.48PYY220 pKa = 11.5VFTRR224 pKa = 11.84DD225 pKa = 4.02AYY227 pKa = 9.35IQHH230 pKa = 6.53KK231 pKa = 9.07NFRR234 pKa = 11.84ATGGEE239 pKa = 4.21TPVDD243 pKa = 3.54EE244 pKa = 5.2PEE246 pKa = 4.56NEE248 pKa = 4.15EE249 pKa = 4.59QLDD252 pKa = 4.14DD253 pKa = 4.11YY254 pKa = 11.49LDD256 pKa = 4.79EE257 pKa = 6.45IDD259 pKa = 5.85DD260 pKa = 4.03YY261 pKa = 12.23
MM1 pKa = 7.15LTASLVGCADD11 pKa = 3.46TPEE14 pKa = 4.19NQEE17 pKa = 4.23KK18 pKa = 8.53EE19 pKa = 4.59TVPTNVAEE27 pKa = 4.24QINAEE32 pKa = 4.13EE33 pKa = 4.3FEE35 pKa = 4.71SVNDD39 pKa = 3.55VYY41 pKa = 11.68DD42 pKa = 3.89PLEE45 pKa = 4.16GFNRR49 pKa = 11.84VMWDD53 pKa = 3.28LNYY56 pKa = 10.98DD57 pKa = 3.65YY58 pKa = 10.95LDD60 pKa = 4.58PYY62 pKa = 10.23LARR65 pKa = 11.84PISLAYY71 pKa = 10.11VDD73 pKa = 4.12YY74 pKa = 10.21TPNPVRR80 pKa = 11.84LGIANFFANLDD91 pKa = 3.81EE92 pKa = 4.67PASMVNSLIMQNPEE106 pKa = 3.39DD107 pKa = 4.02AVAHH111 pKa = 6.5FNRR114 pKa = 11.84FWINTVFGIAGLIDD128 pKa = 3.29IASAADD134 pKa = 3.62IPPPSNRR141 pKa = 11.84AFGDD145 pKa = 3.38SLGYY149 pKa = 10.42YY150 pKa = 10.16GVGNGPYY157 pKa = 10.43FMVPFYY163 pKa = 11.43GPVTLRR169 pKa = 11.84EE170 pKa = 4.32GVGDD174 pKa = 3.95AADD177 pKa = 3.91GLYY180 pKa = 10.87LPLSLLTFWQSLGKK194 pKa = 9.01WAFEE198 pKa = 3.91GMEE201 pKa = 4.21DD202 pKa = 3.66RR203 pKa = 11.84AALVKK208 pKa = 10.53QEE210 pKa = 4.68ALLEE214 pKa = 4.53DD215 pKa = 4.01SPDD218 pKa = 3.48PYY220 pKa = 11.5VFTRR224 pKa = 11.84DD225 pKa = 4.02AYY227 pKa = 9.35IQHH230 pKa = 6.53KK231 pKa = 9.07NFRR234 pKa = 11.84ATGGEE239 pKa = 4.21TPVDD243 pKa = 3.54EE244 pKa = 5.2PEE246 pKa = 4.56NEE248 pKa = 4.15EE249 pKa = 4.59QLDD252 pKa = 4.14DD253 pKa = 4.11YY254 pKa = 11.49LDD256 pKa = 4.79EE257 pKa = 6.45IDD259 pKa = 5.85DD260 pKa = 4.03YY261 pKa = 12.23
Molecular weight: 29.15 kDa
Isoelectric point according different methods:
Protein with the highest isoelectric point:
>tr|Q6LHR5|Q6LHR5_PHOPR Uncharacterized protein OS=Photobacterium profundum (strain SS9) OX=298386 GN=PBPRB1294 PE=4 SV=1
MM1 pKa = 7.67GNQSIKK7 pKa = 9.78TLNASNTHH15 pKa = 6.7PIVLIRR21 pKa = 11.84GLLRR25 pKa = 11.84EE26 pKa = 3.93QRR28 pKa = 11.84HH29 pKa = 5.36WGDD32 pKa = 3.97FLNQLITQFPKK43 pKa = 10.59RR44 pKa = 11.84QIICIDD50 pKa = 3.32LAGNGKK56 pKa = 7.8RR57 pKa = 11.84HH58 pKa = 6.35KK59 pKa = 10.4LQSPKK64 pKa = 10.48NIPAMVQDD72 pKa = 6.05LRR74 pKa = 11.84IQLCLKK80 pKa = 9.17LTTDD84 pKa = 3.74TPVDD88 pKa = 5.0LIALSMGGMIAISWMTLFPTEE109 pKa = 3.79IRR111 pKa = 11.84SAILMNTSVRR121 pKa = 11.84PLSPFYY127 pKa = 10.82QRR129 pKa = 11.84LNWRR133 pKa = 11.84HH134 pKa = 4.16TT135 pKa = 3.48
MM1 pKa = 7.67GNQSIKK7 pKa = 9.78TLNASNTHH15 pKa = 6.7PIVLIRR21 pKa = 11.84GLLRR25 pKa = 11.84EE26 pKa = 3.93QRR28 pKa = 11.84HH29 pKa = 5.36WGDD32 pKa = 3.97FLNQLITQFPKK43 pKa = 10.59RR44 pKa = 11.84QIICIDD50 pKa = 3.32LAGNGKK56 pKa = 7.8RR57 pKa = 11.84HH58 pKa = 6.35KK59 pKa = 10.4LQSPKK64 pKa = 10.48NIPAMVQDD72 pKa = 6.05LRR74 pKa = 11.84IQLCLKK80 pKa = 9.17LTTDD84 pKa = 3.74TPVDD88 pKa = 5.0LIALSMGGMIAISWMTLFPTEE109 pKa = 3.79IRR111 pKa = 11.84SAILMNTSVRR121 pKa = 11.84PLSPFYY127 pKa = 10.82QRR129 pKa = 11.84LNWRR133 pKa = 11.84HH134 pKa = 4.16TT135 pKa = 3.48
Molecular weight: 15.43 kDa
Isoelectric point according different methods:
Peptides (in silico digests for buttom-up proteomics)
Below you can find in silico digests of the whole proteome with Trypsin, Chymotrypsin, Trypsin+LysC, LysN, ArgC proteases suitable for different mass spec machines.| Try ESI |
 |
|---|
| ChTry ESI |
 |
|---|
| ArgC ESI |
 |
|---|
| LysN ESI |
 |
|---|
| TryLysC ESI |
 |
|---|
| Try MALDI |
 |
|---|
| ChTry MALDI |
 |
|---|
| ArgC MALDI |
 |
|---|
| LysN MALDI |
 |
|---|
| TryLysC MALDI |
 |
|---|
| Try LTQ |
 |
|---|
| ChTry LTQ |
 |
|---|
| ArgC LTQ |
 |
|---|
| LysN LTQ |
 |
|---|
| TryLysC LTQ |
 |
|---|
| Try MSlow |
 |
|---|
| ChTry MSlow |
 |
|---|
| ArgC MSlow |
 |
|---|
| LysN MSlow |
 |
|---|
| TryLysC MSlow |
 |
|---|
| Try MShigh |
 |
|---|
| ChTry MShigh |
 |
|---|
| ArgC MShigh |
 |
|---|
| LysN MShigh |
 |
|---|
| TryLysC MShigh |
 |
|---|
General Statistics
Number of major isoforms |
Number of additional isoforms |
Number of all proteins |
Number of amino acids |
Min. Seq. Length |
Max. Seq. Length |
Avg. Seq. Length |
Avg. Mol. Weight |
|---|---|---|---|---|---|---|---|
0 |
1694257 |
35 |
4684 |
318.0 |
35.37 |
Amino acid frequency
Ala |
Cys |
Asp |
Glu |
Phe |
Gly |
His |
Ile |
Lys |
Leu |
|---|---|---|---|---|---|---|---|---|---|
8.403 ± 0.037 | 1.142 ± 0.012 |
5.529 ± 0.033 | 5.956 ± 0.03 |
4.104 ± 0.023 | 6.691 ± 0.032 |
2.263 ± 0.017 | 6.731 ± 0.027 |
5.405 ± 0.028 | 10.277 ± 0.046 |
Met |
Asn |
Gln |
Pro |
Arg |
Ser |
Thr |
Val |
Trp |
Tyr |
|---|---|---|---|---|---|---|---|---|---|
2.762 ± 0.016 | 4.5 ± 0.025 |
3.835 ± 0.02 | 4.447 ± 0.03 |
4.5 ± 0.029 | 6.655 ± 0.031 |
5.634 ± 0.031 | 6.832 ± 0.031 |
1.267 ± 0.013 | 3.067 ± 0.02 |
Most of the basic statistics you can see at this page can be downloaded from this CSV file
Proteome-pI is available under Creative Commons Attribution-NoDerivs license, for more details see here
| Reference: Kozlowski LP. Proteome-pI 2.0: Proteome Isoelectric Point Database Update. Nucleic Acids Res. 2021, doi: 10.1093/nar/gkab944 | Contact: Lukasz P. Kozlowski |
