Nematostella vectensis (Starlet sea anemone)
Taxonomy: cellular organisms; Eukaryota; Opisthokonta; Metazoa; Eumetazoa; Cnidaria; Anthozoa; Hexacorallia; Actiniaria; Edwardsiidae; Nematostella
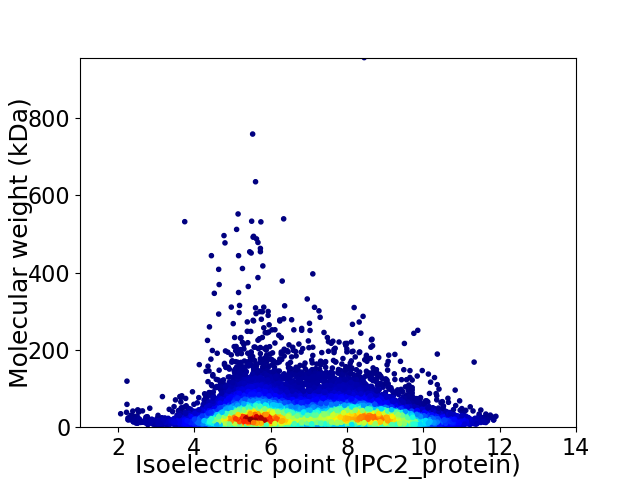
Average proteome isoelectric point is 6.99
Get precalculated fractions of proteins

Virtual 2D-PAGE plot for 24444 proteins (isoelectric point calculated using IPC2_protein)
Get csv file with sequences according to given criteria:
* You can choose from 21 different methods for calculating isoelectric point
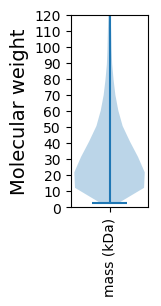
Summary statistics related to proteome-wise predictions


Protein with the lowest isoelectric point:
>tr|A7T6T1|A7T6T1_NEMVE Predicted protein (Fragment) OS=Nematostella vectensis OX=45351 GN=v1g148194 PE=4 SV=1
MM1 pKa = 7.55LFQRR5 pKa = 11.84GRR7 pKa = 11.84YY8 pKa = 6.19FTQGSFKK15 pKa = 10.82NVGFAYY21 pKa = 9.47MKK23 pKa = 10.11VFVMMIAVVNVAAVVVSVDD42 pKa = 3.03AAADD46 pKa = 3.6VSVDD50 pKa = 3.02IATVAVNVDD59 pKa = 3.34VVAVFVNVDD68 pKa = 2.76VDD70 pKa = 3.9AVVVNVGVAAVVAVSNVCVAAVVVNVATVVVNVDD104 pKa = 3.08AAAVVVGVDD113 pKa = 3.36VATFAADD120 pKa = 3.07VDD122 pKa = 4.22VAAVVVYY129 pKa = 10.77VDD131 pKa = 4.49FAAVVVNVDD140 pKa = 3.24VAAVIVNVDD149 pKa = 3.26VAVVVRR155 pKa = 11.84NVDD158 pKa = 3.02VAAAIFVNVDD168 pKa = 3.17VEE170 pKa = 4.84TVGVNVDD177 pKa = 3.08VAAAVVNDD185 pKa = 3.97DD186 pKa = 3.64VASVVVNVDD195 pKa = 2.42VFAAVVNVAAVVVSVDD211 pKa = 3.2AAADD215 pKa = 3.95LLLMLQQLLLVLMLLQIQNDD235 pKa = 3.76YY236 pKa = 11.17NALNEE241 pKa = 4.34CNSCRR246 pKa = 11.84VAMDD250 pKa = 3.93SSNSSILILFYY261 pKa = 10.74HH262 pKa = 5.51SQCVSMHH269 pKa = 7.08RR270 pKa = 11.84IFLYY274 pKa = 10.58CSHH277 pKa = 6.51TPILKK282 pKa = 7.9MTTTHH287 pKa = 7.06SIRR290 pKa = 11.84VTAVGSQWNLVIEE303 pKa = 4.51VSS305 pKa = 3.38
MM1 pKa = 7.55LFQRR5 pKa = 11.84GRR7 pKa = 11.84YY8 pKa = 6.19FTQGSFKK15 pKa = 10.82NVGFAYY21 pKa = 9.47MKK23 pKa = 10.11VFVMMIAVVNVAAVVVSVDD42 pKa = 3.03AAADD46 pKa = 3.6VSVDD50 pKa = 3.02IATVAVNVDD59 pKa = 3.34VVAVFVNVDD68 pKa = 2.76VDD70 pKa = 3.9AVVVNVGVAAVVAVSNVCVAAVVVNVATVVVNVDD104 pKa = 3.08AAAVVVGVDD113 pKa = 3.36VATFAADD120 pKa = 3.07VDD122 pKa = 4.22VAAVVVYY129 pKa = 10.77VDD131 pKa = 4.49FAAVVVNVDD140 pKa = 3.24VAAVIVNVDD149 pKa = 3.26VAVVVRR155 pKa = 11.84NVDD158 pKa = 3.02VAAAIFVNVDD168 pKa = 3.17VEE170 pKa = 4.84TVGVNVDD177 pKa = 3.08VAAAVVNDD185 pKa = 3.97DD186 pKa = 3.64VASVVVNVDD195 pKa = 2.42VFAAVVNVAAVVVSVDD211 pKa = 3.2AAADD215 pKa = 3.95LLLMLQQLLLVLMLLQIQNDD235 pKa = 3.76YY236 pKa = 11.17NALNEE241 pKa = 4.34CNSCRR246 pKa = 11.84VAMDD250 pKa = 3.93SSNSSILILFYY261 pKa = 10.74HH262 pKa = 5.51SQCVSMHH269 pKa = 7.08RR270 pKa = 11.84IFLYY274 pKa = 10.58CSHH277 pKa = 6.51TPILKK282 pKa = 7.9MTTTHH287 pKa = 7.06SIRR290 pKa = 11.84VTAVGSQWNLVIEE303 pKa = 4.51VSS305 pKa = 3.38
Molecular weight: 31.8 kDa
Isoelectric point according different methods:
Protein with the highest isoelectric point:
>tr|A7T7G3|A7T7G3_NEMVE Predicted protein OS=Nematostella vectensis OX=45351 GN=v1g148833 PE=4 SV=1
HHH2 pKa = 7.02NRR4 pKa = 11.84LPGLTSINTNRR15 pKa = 11.84LPGLTSINTNRR26 pKa = 11.84LPGLTSINTNRR37 pKa = 11.84LPGLTSINTNRR48 pKa = 11.84LPGLTSINTNRR59 pKa = 11.84LPGLTSINTNRR70 pKa = 11.84LPGLTSINTNRR81 pKa = 11.84LPGLTSINTNRR92 pKa = 11.84LPGLTSINTNRR103 pKa = 11.84LPGLTSINTNRR114 pKa = 11.84LPGLTSINTNRR125 pKa = 11.84LPGLTSINTNRR136 pKa = 11.84LPG
HHH2 pKa = 7.02NRR4 pKa = 11.84LPGLTSINTNRR15 pKa = 11.84LPGLTSINTNRR26 pKa = 11.84LPGLTSINTNRR37 pKa = 11.84LPGLTSINTNRR48 pKa = 11.84LPGLTSINTNRR59 pKa = 11.84LPGLTSINTNRR70 pKa = 11.84LPGLTSINTNRR81 pKa = 11.84LPGLTSINTNRR92 pKa = 11.84LPGLTSINTNRR103 pKa = 11.84LPGLTSINTNRR114 pKa = 11.84LPGLTSINTNRR125 pKa = 11.84LPGLTSINTNRR136 pKa = 11.84LPG
Molecular weight: 14.8 kDa
Isoelectric point according different methods:
Peptides (in silico digests for buttom-up proteomics)
Below you can find in silico digests of the whole proteome with Trypsin, Chymotrypsin, Trypsin+LysC, LysN, ArgC proteases suitable for different mass spec machines.| Try ESI |
 |
|---|
| ChTry ESI |
 |
|---|
| ArgC ESI |
 |
|---|
| LysN ESI |
 |
|---|
| TryLysC ESI |
 |
|---|
| Try MALDI |
 |
|---|
| ChTry MALDI |
 |
|---|
| ArgC MALDI |
 |
|---|
| LysN MALDI |
 |
|---|
| TryLysC MALDI |
 |
|---|
| Try LTQ |
 |
|---|
| ChTry LTQ |
 |
|---|
| ArgC LTQ |
 |
|---|
| LysN LTQ |
 |
|---|
| TryLysC LTQ |
 |
|---|
| Try MSlow |
 |
|---|
| ChTry MSlow |
 |
|---|
| ArgC MSlow |
 |
|---|
| LysN MSlow |
 |
|---|
| TryLysC MSlow |
 |
|---|
| Try MShigh |
 |
|---|
| ChTry MShigh |
 |
|---|
| ArgC MShigh |
 |
|---|
| LysN MShigh |
 |
|---|
| TryLysC MShigh |
 |
|---|
General Statistics
Number of major isoforms |
Number of additional isoforms |
Number of all proteins |
Number of amino acids |
Min. Seq. Length |
Max. Seq. Length |
Avg. Seq. Length |
Avg. Mol. Weight |
|---|---|---|---|---|---|---|---|
8260506 |
23 |
8745 |
337.9 |
37.99 |
Amino acid frequency
Ala |
Cys |
Asp |
Glu |
Phe |
Gly |
His |
Ile |
Lys |
Leu |
|---|---|---|---|---|---|---|---|---|---|
6.417 ± 0.018 | 2.432 ± 0.019 |
5.257 ± 0.016 | 5.981 ± 0.023 |
4.044 ± 0.014 | 6.18 ± 0.022 |
2.697 ± 0.014 | 5.418 ± 0.016 |
6.151 ± 0.019 | 9.24 ± 0.023 |
Met |
Asn |
Gln |
Pro |
Arg |
Ser |
Thr |
Val |
Trp |
Tyr |
|---|---|---|---|---|---|---|---|---|---|
2.389 ± 0.008 | 4.28 ± 0.015 |
4.916 ± 0.019 | 3.898 ± 0.013 |
5.525 ± 0.019 | 7.765 ± 0.023 |
5.976 ± 0.018 | 6.718 ± 0.017 |
1.292 ± 0.008 | 3.423 ± 0.015 |
Most of the basic statistics you can see at this page can be downloaded from this CSV file
Proteome-pI is available under Creative Commons Attribution-NoDerivs license, for more details see here
| Reference: Kozlowski LP. Proteome-pI 2.0: Proteome Isoelectric Point Database Update. Nucleic Acids Res. 2021, doi: 10.1093/nar/gkab944 | Contact: Lukasz P. Kozlowski |
