Hyperthermus butylicus (strain DSM 5456 / JCM 9403 / PLM1-5)
Taxonomy: cellular organisms; Archaea; TACK group; Crenarchaeota; Thermoprotei; Desulfurococcales; Pyrodictiaceae; Hyperthermus; Hyperthermus butylicus
Average proteome isoelectric point is 7.09
Get precalculated fractions of proteins

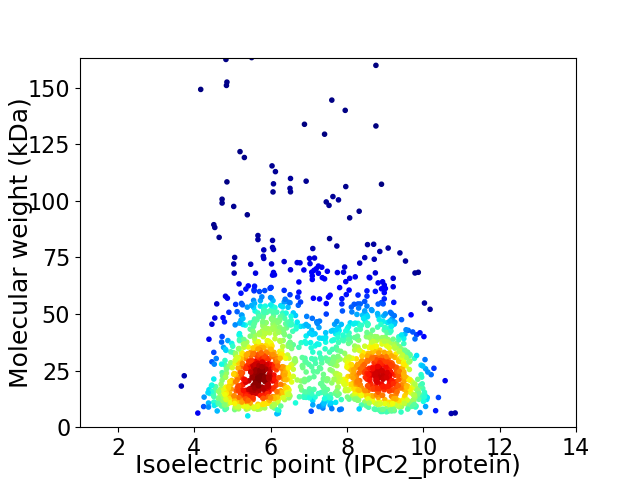
Virtual 2D-PAGE plot for 1602 proteins (isoelectric point calculated using IPC2_protein)
Get csv file with sequences according to given criteria:
* You can choose from 21 different methods for calculating isoelectric point
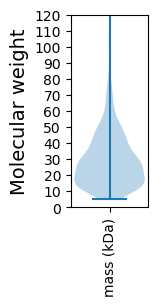
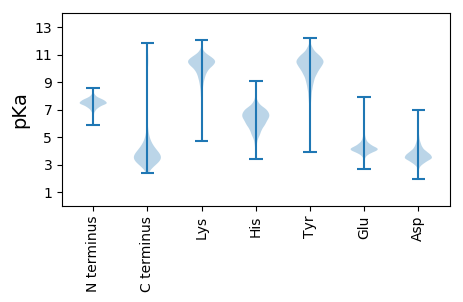
Summary statistics related to proteome-wise predictions


Protein with the lowest isoelectric point:
>tr|A2BMJ1|A2BMJ1_HYPBU 4Fe-4S ferredoxin-type domain-containing protein OS=Hyperthermus butylicus (strain DSM 5456 / JCM 9403 / PLM1-5) OX=415426 GN=Hbut_1377 PE=4 SV=1
MM1 pKa = 7.47APEE4 pKa = 3.71EE5 pKa = 4.93AAWCWMWARR14 pKa = 11.84PFYY17 pKa = 10.86VVYY20 pKa = 10.74NVTYY24 pKa = 10.55CFMAACEE31 pKa = 4.24DD32 pKa = 3.61AGEE35 pKa = 4.32EE36 pKa = 4.13YY37 pKa = 10.17MAVITNVKK45 pKa = 10.27SDD47 pKa = 3.25GLYY50 pKa = 9.8ISGSVGFGLPPEE62 pKa = 4.66TIMNALLSGTEE73 pKa = 4.0SNIVFISNTPLADD86 pKa = 4.03GDD88 pKa = 4.32LDD90 pKa = 3.96PGEE93 pKa = 4.63FVDD96 pKa = 5.53LRR98 pKa = 11.84DD99 pKa = 3.27IFRR102 pKa = 11.84SYY104 pKa = 9.22DD105 pKa = 3.06TCGADD110 pKa = 3.63FEE112 pKa = 4.81IGIPIGAMLAVPACAALGLPTGGAACAALTAFMSSFAVTISAEE155 pKa = 4.36SPSVTVYY162 pKa = 11.38GNIGNLGDD170 pKa = 3.82TPSIEE175 pKa = 3.81NDD177 pKa = 3.33VNVFEE182 pKa = 4.19YY183 pKa = 11.11VYY185 pKa = 9.86MAEE188 pKa = 3.78SRR190 pKa = 11.84YY191 pKa = 10.14KK192 pKa = 10.28YY193 pKa = 10.79VYY195 pKa = 10.39GDD197 pKa = 3.45CEE199 pKa = 4.49YY200 pKa = 10.41NVPVGMVIEE209 pKa = 4.53FRR211 pKa = 3.93
MM1 pKa = 7.47APEE4 pKa = 3.71EE5 pKa = 4.93AAWCWMWARR14 pKa = 11.84PFYY17 pKa = 10.86VVYY20 pKa = 10.74NVTYY24 pKa = 10.55CFMAACEE31 pKa = 4.24DD32 pKa = 3.61AGEE35 pKa = 4.32EE36 pKa = 4.13YY37 pKa = 10.17MAVITNVKK45 pKa = 10.27SDD47 pKa = 3.25GLYY50 pKa = 9.8ISGSVGFGLPPEE62 pKa = 4.66TIMNALLSGTEE73 pKa = 4.0SNIVFISNTPLADD86 pKa = 4.03GDD88 pKa = 4.32LDD90 pKa = 3.96PGEE93 pKa = 4.63FVDD96 pKa = 5.53LRR98 pKa = 11.84DD99 pKa = 3.27IFRR102 pKa = 11.84SYY104 pKa = 9.22DD105 pKa = 3.06TCGADD110 pKa = 3.63FEE112 pKa = 4.81IGIPIGAMLAVPACAALGLPTGGAACAALTAFMSSFAVTISAEE155 pKa = 4.36SPSVTVYY162 pKa = 11.38GNIGNLGDD170 pKa = 3.82TPSIEE175 pKa = 3.81NDD177 pKa = 3.33VNVFEE182 pKa = 4.19YY183 pKa = 11.11VYY185 pKa = 9.86MAEE188 pKa = 3.78SRR190 pKa = 11.84YY191 pKa = 10.14KK192 pKa = 10.28YY193 pKa = 10.79VYY195 pKa = 10.39GDD197 pKa = 3.45CEE199 pKa = 4.49YY200 pKa = 10.41NVPVGMVIEE209 pKa = 4.53FRR211 pKa = 3.93
Molecular weight: 22.71 kDa
Isoelectric point according different methods:
Protein with the highest isoelectric point:
>sp|A2BN64|RL1_HYPBU 50S ribosomal protein L1 OS=Hyperthermus butylicus (strain DSM 5456 / JCM 9403 / PLM1-5) OX=415426 GN=rpl1 PE=3 SV=1
MM1 pKa = 7.51AHH3 pKa = 6.89FKK5 pKa = 10.66PLGKK9 pKa = 10.13KK10 pKa = 9.79LRR12 pKa = 11.84LAKK15 pKa = 10.28ALKK18 pKa = 9.77QNRR21 pKa = 11.84SVPIWVIIKK30 pKa = 6.92TNRR33 pKa = 11.84RR34 pKa = 11.84FRR36 pKa = 11.84DD37 pKa = 3.48HH38 pKa = 7.22PKK40 pKa = 8.53RR41 pKa = 11.84RR42 pKa = 11.84HH43 pKa = 3.73WRR45 pKa = 11.84RR46 pKa = 11.84TKK48 pKa = 10.87LKK50 pKa = 10.48AA51 pKa = 3.35
MM1 pKa = 7.51AHH3 pKa = 6.89FKK5 pKa = 10.66PLGKK9 pKa = 10.13KK10 pKa = 9.79LRR12 pKa = 11.84LAKK15 pKa = 10.28ALKK18 pKa = 9.77QNRR21 pKa = 11.84SVPIWVIIKK30 pKa = 6.92TNRR33 pKa = 11.84RR34 pKa = 11.84FRR36 pKa = 11.84DD37 pKa = 3.48HH38 pKa = 7.22PKK40 pKa = 8.53RR41 pKa = 11.84RR42 pKa = 11.84HH43 pKa = 3.73WRR45 pKa = 11.84RR46 pKa = 11.84TKK48 pKa = 10.87LKK50 pKa = 10.48AA51 pKa = 3.35
Molecular weight: 6.28 kDa
Isoelectric point according different methods:
Peptides (in silico digests for buttom-up proteomics)
Below you can find in silico digests of the whole proteome with Trypsin, Chymotrypsin, Trypsin+LysC, LysN, ArgC proteases suitable for different mass spec machines.| Try ESI |
 |
|---|
| ChTry ESI |
 |
|---|
| ArgC ESI |
 |
|---|
| LysN ESI |
 |
|---|
| TryLysC ESI |
 |
|---|
| Try MALDI |
 |
|---|
| ChTry MALDI |
 |
|---|
| ArgC MALDI |
 |
|---|
| LysN MALDI |
 |
|---|
| TryLysC MALDI |
 |
|---|
| Try LTQ |
 |
|---|
| ChTry LTQ |
 |
|---|
| ArgC LTQ |
 |
|---|
| LysN LTQ |
 |
|---|
| TryLysC LTQ |
 |
|---|
| Try MSlow |
 |
|---|
| ChTry MSlow |
 |
|---|
| ArgC MSlow |
 |
|---|
| LysN MSlow |
 |
|---|
| TryLysC MSlow |
 |
|---|
| Try MShigh |
 |
|---|
| ChTry MShigh |
 |
|---|
| ArgC MShigh |
 |
|---|
| LysN MShigh |
 |
|---|
| TryLysC MShigh |
 |
|---|
General Statistics
Number of major isoforms |
Number of additional isoforms |
Number of all proteins |
Number of amino acids |
Min. Seq. Length |
Max. Seq. Length |
Avg. Seq. Length |
Avg. Mol. Weight |
|---|---|---|---|---|---|---|---|
0 |
449830 |
44 |
1507 |
280.8 |
31.13 |
Amino acid frequency
Ala |
Cys |
Asp |
Glu |
Phe |
Gly |
His |
Ile |
Lys |
Leu |
|---|---|---|---|---|---|---|---|---|---|
10.062 ± 0.092 | 0.922 ± 0.028 |
4.187 ± 0.039 | 7.68 ± 0.07 |
2.712 ± 0.039 | 7.62 ± 0.058 |
1.79 ± 0.025 | 6.171 ± 0.057 |
4.507 ± 0.069 | 11.138 ± 0.074 |
Met |
Asn |
Gln |
Pro |
Arg |
Ser |
Thr |
Val |
Trp |
Tyr |
|---|---|---|---|---|---|---|---|---|---|
2.108 ± 0.024 | 2.166 ± 0.03 |
5.062 ± 0.038 | 1.999 ± 0.029 |
7.811 ± 0.067 | 5.302 ± 0.05 |
4.399 ± 0.045 | 9.215 ± 0.055 |
1.24 ± 0.026 | 3.907 ± 0.036 |
Most of the basic statistics you can see at this page can be downloaded from this CSV file
Proteome-pI is available under Creative Commons Attribution-NoDerivs license, for more details see here
| Reference: Kozlowski LP. Proteome-pI 2.0: Proteome Isoelectric Point Database Update. Nucleic Acids Res. 2021, doi: 10.1093/nar/gkab944 | Contact: Lukasz P. Kozlowski |
