Roseibacterium elongatum DSM 19469
Taxonomy: cellular organisms; Bacteria; Proteobacteria; Alphaproteobacteria; Rhodobacterales; Roseobacteraceae; Roseibacterium; Roseibacterium elongatum
Average proteome isoelectric point is 6.17
Get precalculated fractions of proteins

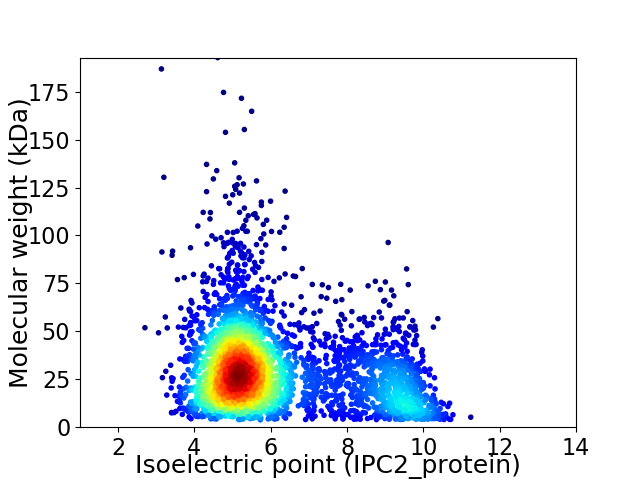
Virtual 2D-PAGE plot for 3433 proteins (isoelectric point calculated using IPC2_protein)
Get csv file with sequences according to given criteria:
* You can choose from 21 different methods for calculating isoelectric point
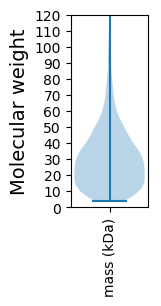
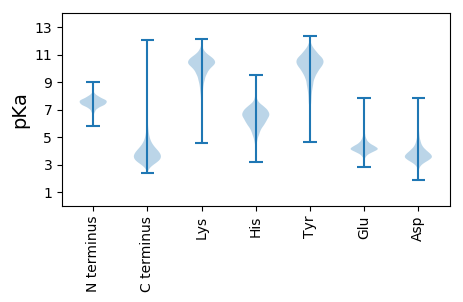
Summary statistics related to proteome-wise predictions


Protein with the lowest isoelectric point:
>tr|W8RU49|W8RU49_9RHOB Serine acetyltransferase OS=Roseibacterium elongatum DSM 19469 OX=1294273 GN=roselon_02429 PE=3 SV=1
MM1 pKa = 7.4AAAPGTGGGGGGTGTGGTGGTGGGGTGDD29 pKa = 4.08PGTGGGGTGGTGGGGTGGTGGGTGGGTTDD58 pKa = 4.59PDD60 pKa = 3.86PVTPYY65 pKa = 10.26IPTSPVVGCPSTDD78 pKa = 3.64YY79 pKa = 11.17LGEE82 pKa = 4.64AYY84 pKa = 7.07TTTGEE89 pKa = 4.13DD90 pKa = 4.13LEE92 pKa = 5.57DD93 pKa = 3.26EE94 pKa = 4.64TVRR97 pKa = 11.84LDD99 pKa = 3.76ASGGGQTPLDD109 pKa = 4.27SCPGIPGTGYY119 pKa = 10.91VYY121 pKa = 11.07ANPTFSLYY129 pKa = 10.63LSEE132 pKa = 4.56MDD134 pKa = 3.47DD135 pKa = 3.68FEE137 pKa = 5.75RR138 pKa = 11.84FVVRR142 pKa = 11.84IHH144 pKa = 6.93SDD146 pKa = 3.21CDD148 pKa = 3.36TTLLLRR154 pKa = 11.84DD155 pKa = 3.61AQGNYY160 pKa = 10.12HH161 pKa = 6.78FDD163 pKa = 4.42DD164 pKa = 5.72DD165 pKa = 5.58SGPDD169 pKa = 3.23LNGRR173 pKa = 11.84LRR175 pKa = 11.84LRR177 pKa = 11.84DD178 pKa = 3.78MEE180 pKa = 4.54PLNGRR185 pKa = 11.84VDD187 pKa = 3.58IYY189 pKa = 11.56VGTFDD194 pKa = 6.03GDD196 pKa = 3.59TCNDD200 pKa = 3.22VQVRR204 pKa = 11.84LILRR208 pKa = 11.84DD209 pKa = 3.35
MM1 pKa = 7.4AAAPGTGGGGGGTGTGGTGGTGGGGTGDD29 pKa = 4.08PGTGGGGTGGTGGGGTGGTGGGTGGGTTDD58 pKa = 4.59PDD60 pKa = 3.86PVTPYY65 pKa = 10.26IPTSPVVGCPSTDD78 pKa = 3.64YY79 pKa = 11.17LGEE82 pKa = 4.64AYY84 pKa = 7.07TTTGEE89 pKa = 4.13DD90 pKa = 4.13LEE92 pKa = 5.57DD93 pKa = 3.26EE94 pKa = 4.64TVRR97 pKa = 11.84LDD99 pKa = 3.76ASGGGQTPLDD109 pKa = 4.27SCPGIPGTGYY119 pKa = 10.91VYY121 pKa = 11.07ANPTFSLYY129 pKa = 10.63LSEE132 pKa = 4.56MDD134 pKa = 3.47DD135 pKa = 3.68FEE137 pKa = 5.75RR138 pKa = 11.84FVVRR142 pKa = 11.84IHH144 pKa = 6.93SDD146 pKa = 3.21CDD148 pKa = 3.36TTLLLRR154 pKa = 11.84DD155 pKa = 3.61AQGNYY160 pKa = 10.12HH161 pKa = 6.78FDD163 pKa = 4.42DD164 pKa = 5.72DD165 pKa = 5.58SGPDD169 pKa = 3.23LNGRR173 pKa = 11.84LRR175 pKa = 11.84LRR177 pKa = 11.84DD178 pKa = 3.78MEE180 pKa = 4.54PLNGRR185 pKa = 11.84VDD187 pKa = 3.58IYY189 pKa = 11.56VGTFDD194 pKa = 6.03GDD196 pKa = 3.59TCNDD200 pKa = 3.22VQVRR204 pKa = 11.84LILRR208 pKa = 11.84DD209 pKa = 3.35
Molecular weight: 20.86 kDa
Isoelectric point according different methods:
Protein with the highest isoelectric point:
>tr|W8S5X5|W8S5X5_9RHOB Uncharacterized protein OS=Roseibacterium elongatum DSM 19469 OX=1294273 GN=roselon_03379 PE=4 SV=1
MM1 pKa = 7.69SKK3 pKa = 9.01RR4 pKa = 11.84TFQPSNLVRR13 pKa = 11.84KK14 pKa = 9.18RR15 pKa = 11.84RR16 pKa = 11.84HH17 pKa = 4.42GFRR20 pKa = 11.84ARR22 pKa = 11.84MATKK26 pKa = 10.37AGRR29 pKa = 11.84KK30 pKa = 8.54ILNARR35 pKa = 11.84RR36 pKa = 11.84ARR38 pKa = 11.84GRR40 pKa = 11.84KK41 pKa = 9.07SLSAA45 pKa = 3.93
MM1 pKa = 7.69SKK3 pKa = 9.01RR4 pKa = 11.84TFQPSNLVRR13 pKa = 11.84KK14 pKa = 9.18RR15 pKa = 11.84RR16 pKa = 11.84HH17 pKa = 4.42GFRR20 pKa = 11.84ARR22 pKa = 11.84MATKK26 pKa = 10.37AGRR29 pKa = 11.84KK30 pKa = 8.54ILNARR35 pKa = 11.84RR36 pKa = 11.84ARR38 pKa = 11.84GRR40 pKa = 11.84KK41 pKa = 9.07SLSAA45 pKa = 3.93
Molecular weight: 5.22 kDa
Isoelectric point according different methods:
Peptides (in silico digests for buttom-up proteomics)
Below you can find in silico digests of the whole proteome with Trypsin, Chymotrypsin, Trypsin+LysC, LysN, ArgC proteases suitable for different mass spec machines.| Try ESI |
 |
|---|
| ChTry ESI |
 |
|---|
| ArgC ESI |
 |
|---|
| LysN ESI |
 |
|---|
| TryLysC ESI |
 |
|---|
| Try MALDI |
 |
|---|
| ChTry MALDI |
 |
|---|
| ArgC MALDI |
 |
|---|
| LysN MALDI |
 |
|---|
| TryLysC MALDI |
 |
|---|
| Try LTQ |
 |
|---|
| ChTry LTQ |
 |
|---|
| ArgC LTQ |
 |
|---|
| LysN LTQ |
 |
|---|
| TryLysC LTQ |
 |
|---|
| Try MSlow |
 |
|---|
| ChTry MSlow |
 |
|---|
| ArgC MSlow |
 |
|---|
| LysN MSlow |
 |
|---|
| TryLysC MSlow |
 |
|---|
| Try MShigh |
 |
|---|
| ChTry MShigh |
 |
|---|
| ArgC MShigh |
 |
|---|
| LysN MShigh |
 |
|---|
| TryLysC MShigh |
 |
|---|
General Statistics
Number of major isoforms |
Number of additional isoforms |
Number of all proteins |
Number of amino acids |
Min. Seq. Length |
Max. Seq. Length |
Avg. Seq. Length |
Avg. Mol. Weight |
|---|---|---|---|---|---|---|---|
0 |
1011806 |
37 |
1857 |
294.7 |
31.86 |
Amino acid frequency
Ala |
Cys |
Asp |
Glu |
Phe |
Gly |
His |
Ile |
Lys |
Leu |
|---|---|---|---|---|---|---|---|---|---|
13.112 ± 0.064 | 0.896 ± 0.014 |
6.327 ± 0.049 | 5.753 ± 0.039 |
3.584 ± 0.03 | 9.064 ± 0.049 |
2.113 ± 0.025 | 4.948 ± 0.031 |
2.416 ± 0.039 | 10.07 ± 0.051 |
Met |
Asn |
Gln |
Pro |
Arg |
Ser |
Thr |
Val |
Trp |
Tyr |
|---|---|---|---|---|---|---|---|---|---|
2.79 ± 0.02 | 2.223 ± 0.025 |
5.485 ± 0.037 | 3.031 ± 0.022 |
7.291 ± 0.05 | 4.67 ± 0.029 |
5.473 ± 0.03 | 7.209 ± 0.036 |
1.433 ± 0.017 | 2.113 ± 0.02 |
Most of the basic statistics you can see at this page can be downloaded from this CSV file
Proteome-pI is available under Creative Commons Attribution-NoDerivs license, for more details see here
| Reference: Kozlowski LP. Proteome-pI 2.0: Proteome Isoelectric Point Database Update. Nucleic Acids Res. 2021, doi: 10.1093/nar/gkab944 | Contact: Lukasz P. Kozlowski |
