Pseudonocardia sp. CNS-139
Taxonomy: cellular organisms; Bacteria; Terrabacteria group; Actinobacteria; Actinomycetia; Pseudonocardiales; Pseudonocardiaceae; Pseudonocardia; unclassified Pseudonocardia
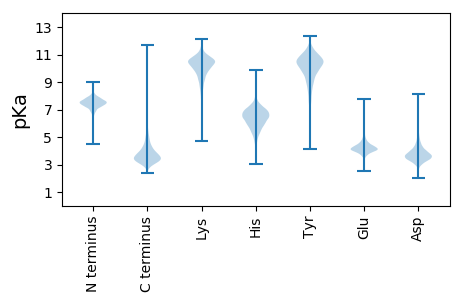
Average proteome isoelectric point is 6.72
Get precalculated fractions of proteins

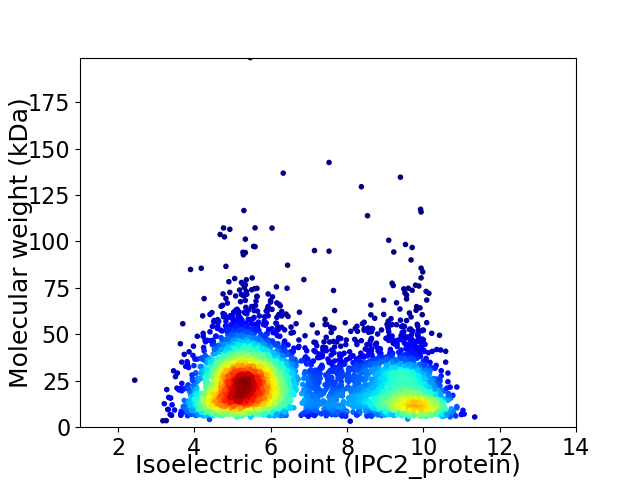
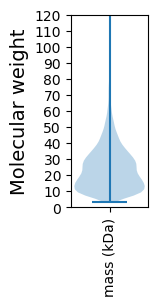
Virtual 2D-PAGE plot for 4969 proteins (isoelectric point calculated using IPC2_protein)
Get csv file with sequences according to given criteria:
* You can choose from 21 different methods for calculating isoelectric point
Summary statistics related to proteome-wise predictions


Protein with the lowest isoelectric point:
>tr|A0A1Q9T9Y1|A0A1Q9T9Y1_9PSEU DUF1508 domain-containing protein OS=Pseudonocardia sp. CNS-139 OX=1904968 GN=BJF78_10100 PE=4 SV=1
MM1 pKa = 7.36IRR3 pKa = 11.84RR4 pKa = 11.84PALMVATAAAAALVLSACGGAEE26 pKa = 4.03EE27 pKa = 4.65PAAPAAPAAPAAPAGGPLDD46 pKa = 3.85LAGVCPATVVLQQDD60 pKa = 3.62WQPEE64 pKa = 4.25AEE66 pKa = 4.43HH67 pKa = 6.25GAMYY71 pKa = 11.02ALVGPDD77 pKa = 3.31YY78 pKa = 11.07TIDD81 pKa = 3.65ADD83 pKa = 3.93AKK85 pKa = 10.1SVTGSLVTQGVDD97 pKa = 2.68TGVDD101 pKa = 3.45VEE103 pKa = 4.47VRR105 pKa = 11.84PGGPNVGFQPVPALMYY121 pKa = 10.52LDD123 pKa = 5.02DD124 pKa = 6.4AITLGAVNTDD134 pKa = 3.3AAIVAAADD142 pKa = 3.56QPTVAVASQMTVSPQILMWDD162 pKa = 4.08PEE164 pKa = 4.52SHH166 pKa = 7.11PGMTTIRR173 pKa = 11.84QIAATGAPVVTSGDD187 pKa = 3.8IIPALLEE194 pKa = 4.01SQGIIQASQSDD205 pKa = 3.83TSYY208 pKa = 10.57EE209 pKa = 3.93GTPARR214 pKa = 11.84FVSDD218 pKa = 3.74PVILQQGFATAEE230 pKa = 3.88PYY232 pKa = 10.0IYY234 pKa = 10.35QNEE237 pKa = 3.99IGEE240 pKa = 4.19WSRR243 pKa = 11.84PVGFEE248 pKa = 3.35PLANYY253 pKa = 9.58GYY255 pKa = 10.47SIYY258 pKa = 10.06PEE260 pKa = 4.24PLAVRR265 pKa = 11.84ADD267 pKa = 3.82RR268 pKa = 11.84LEE270 pKa = 3.61QLRR273 pKa = 11.84PCLEE277 pKa = 3.84KK278 pKa = 10.63LVPIMQQSQIDD289 pKa = 4.04YY290 pKa = 10.17LADD293 pKa = 4.32PGPTNRR299 pKa = 11.84LIVEE303 pKa = 4.36LVEE306 pKa = 5.01AYY308 pKa = 7.53QTGWTYY314 pKa = 11.47SEE316 pKa = 4.52GVADD320 pKa = 6.41FSAQAQVEE328 pKa = 4.42QGFVTNDD335 pKa = 3.23PVSGVFGQFDD345 pKa = 4.18PARR348 pKa = 11.84MAEE351 pKa = 4.12IVSTFGPILQSQGTISSVPDD371 pKa = 3.61ASALYY376 pKa = 10.0TNDD379 pKa = 5.43FIDD382 pKa = 3.64TTIKK386 pKa = 10.07MGG388 pKa = 3.51
MM1 pKa = 7.36IRR3 pKa = 11.84RR4 pKa = 11.84PALMVATAAAAALVLSACGGAEE26 pKa = 4.03EE27 pKa = 4.65PAAPAAPAAPAAPAGGPLDD46 pKa = 3.85LAGVCPATVVLQQDD60 pKa = 3.62WQPEE64 pKa = 4.25AEE66 pKa = 4.43HH67 pKa = 6.25GAMYY71 pKa = 11.02ALVGPDD77 pKa = 3.31YY78 pKa = 11.07TIDD81 pKa = 3.65ADD83 pKa = 3.93AKK85 pKa = 10.1SVTGSLVTQGVDD97 pKa = 2.68TGVDD101 pKa = 3.45VEE103 pKa = 4.47VRR105 pKa = 11.84PGGPNVGFQPVPALMYY121 pKa = 10.52LDD123 pKa = 5.02DD124 pKa = 6.4AITLGAVNTDD134 pKa = 3.3AAIVAAADD142 pKa = 3.56QPTVAVASQMTVSPQILMWDD162 pKa = 4.08PEE164 pKa = 4.52SHH166 pKa = 7.11PGMTTIRR173 pKa = 11.84QIAATGAPVVTSGDD187 pKa = 3.8IIPALLEE194 pKa = 4.01SQGIIQASQSDD205 pKa = 3.83TSYY208 pKa = 10.57EE209 pKa = 3.93GTPARR214 pKa = 11.84FVSDD218 pKa = 3.74PVILQQGFATAEE230 pKa = 3.88PYY232 pKa = 10.0IYY234 pKa = 10.35QNEE237 pKa = 3.99IGEE240 pKa = 4.19WSRR243 pKa = 11.84PVGFEE248 pKa = 3.35PLANYY253 pKa = 9.58GYY255 pKa = 10.47SIYY258 pKa = 10.06PEE260 pKa = 4.24PLAVRR265 pKa = 11.84ADD267 pKa = 3.82RR268 pKa = 11.84LEE270 pKa = 3.61QLRR273 pKa = 11.84PCLEE277 pKa = 3.84KK278 pKa = 10.63LVPIMQQSQIDD289 pKa = 4.04YY290 pKa = 10.17LADD293 pKa = 4.32PGPTNRR299 pKa = 11.84LIVEE303 pKa = 4.36LVEE306 pKa = 5.01AYY308 pKa = 7.53QTGWTYY314 pKa = 11.47SEE316 pKa = 4.52GVADD320 pKa = 6.41FSAQAQVEE328 pKa = 4.42QGFVTNDD335 pKa = 3.23PVSGVFGQFDD345 pKa = 4.18PARR348 pKa = 11.84MAEE351 pKa = 4.12IVSTFGPILQSQGTISSVPDD371 pKa = 3.61ASALYY376 pKa = 10.0TNDD379 pKa = 5.43FIDD382 pKa = 3.64TTIKK386 pKa = 10.07MGG388 pKa = 3.51
Molecular weight: 40.61 kDa
Isoelectric point according different methods:
Protein with the highest isoelectric point:
>tr|A0A1Q9SNR2|A0A1Q9SNR2_9PSEU Uncharacterized protein OS=Pseudonocardia sp. CNS-139 OX=1904968 GN=BJF78_24850 PE=4 SV=1
MM1 pKa = 7.53SKK3 pKa = 10.53GKK5 pKa = 8.66RR6 pKa = 11.84TFQPNNRR13 pKa = 11.84RR14 pKa = 11.84RR15 pKa = 11.84ARR17 pKa = 11.84THH19 pKa = 5.69GFRR22 pKa = 11.84LRR24 pKa = 11.84MRR26 pKa = 11.84TRR28 pKa = 11.84AGRR31 pKa = 11.84AIVSARR37 pKa = 11.84RR38 pKa = 11.84AKK40 pKa = 10.14GRR42 pKa = 11.84QRR44 pKa = 11.84LSAA47 pKa = 4.04
MM1 pKa = 7.53SKK3 pKa = 10.53GKK5 pKa = 8.66RR6 pKa = 11.84TFQPNNRR13 pKa = 11.84RR14 pKa = 11.84RR15 pKa = 11.84ARR17 pKa = 11.84THH19 pKa = 5.69GFRR22 pKa = 11.84LRR24 pKa = 11.84MRR26 pKa = 11.84TRR28 pKa = 11.84AGRR31 pKa = 11.84AIVSARR37 pKa = 11.84RR38 pKa = 11.84AKK40 pKa = 10.14GRR42 pKa = 11.84QRR44 pKa = 11.84LSAA47 pKa = 4.04
Molecular weight: 5.52 kDa
Isoelectric point according different methods:
Peptides (in silico digests for buttom-up proteomics)
Below you can find in silico digests of the whole proteome with Trypsin, Chymotrypsin, Trypsin+LysC, LysN, ArgC proteases suitable for different mass spec machines.| Try ESI |
 |
|---|
| ChTry ESI |
 |
|---|
| ArgC ESI |
 |
|---|
| LysN ESI |
 |
|---|
| TryLysC ESI |
 |
|---|
| Try MALDI |
 |
|---|
| ChTry MALDI |
 |
|---|
| ArgC MALDI |
 |
|---|
| LysN MALDI |
 |
|---|
| TryLysC MALDI |
 |
|---|
| Try LTQ |
 |
|---|
| ChTry LTQ |
 |
|---|
| ArgC LTQ |
 |
|---|
| LysN LTQ |
 |
|---|
| TryLysC LTQ |
 |
|---|
| Try MSlow |
 |
|---|
| ChTry MSlow |
 |
|---|
| ArgC MSlow |
 |
|---|
| LysN MSlow |
 |
|---|
| TryLysC MSlow |
 |
|---|
| Try MShigh |
 |
|---|
| ChTry MShigh |
 |
|---|
| ArgC MShigh |
 |
|---|
| LysN MShigh |
 |
|---|
| TryLysC MShigh |
 |
|---|
General Statistics
Number of major isoforms |
Number of additional isoforms |
Number of all proteins |
Number of amino acids |
Min. Seq. Length |
Max. Seq. Length |
Avg. Seq. Length |
Avg. Mol. Weight |
|---|---|---|---|---|---|---|---|
0 |
1162861 |
30 |
1898 |
234.0 |
24.84 |
Amino acid frequency
Ala |
Cys |
Asp |
Glu |
Phe |
Gly |
His |
Ile |
Lys |
Leu |
|---|---|---|---|---|---|---|---|---|---|
14.819 ± 0.059 | 0.911 ± 0.014 |
5.857 ± 0.036 | 5.031 ± 0.037 |
2.558 ± 0.021 | 9.593 ± 0.041 |
2.126 ± 0.019 | 2.75 ± 0.025 |
1.094 ± 0.017 | 10.155 ± 0.049 |
Met |
Asn |
Gln |
Pro |
Arg |
Ser |
Thr |
Val |
Trp |
Tyr |
|---|---|---|---|---|---|---|---|---|---|
1.718 ± 0.015 | 1.458 ± 0.018 |
6.77 ± 0.036 | 2.476 ± 0.022 |
9.126 ± 0.05 | 4.924 ± 0.033 |
5.884 ± 0.028 | 9.52 ± 0.037 |
1.53 ± 0.016 | 1.7 ± 0.018 |
Most of the basic statistics you can see at this page can be downloaded from this CSV file
Proteome-pI is available under Creative Commons Attribution-NoDerivs license, for more details see here
| Reference: Kozlowski LP. Proteome-pI 2.0: Proteome Isoelectric Point Database Update. Nucleic Acids Res. 2021, doi: 10.1093/nar/gkab944 | Contact: Lukasz P. Kozlowski |
