Bacillus anthracis
Taxonomy: cellular organisms; Bacteria; Terrabacteria group; Firmicutes;
Average proteome isoelectric point is 6.58
Get precalculated fractions of proteins
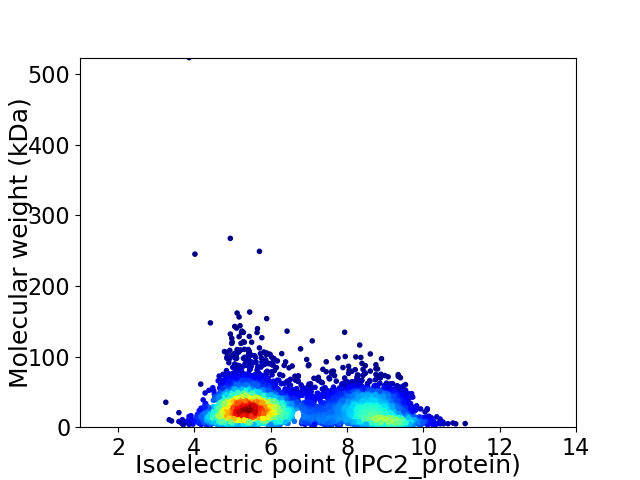
Virtual 2D-PAGE plot for 5493 proteins (isoelectric point calculated using IPC2_protein)
Get csv file with sequences according to given criteria:
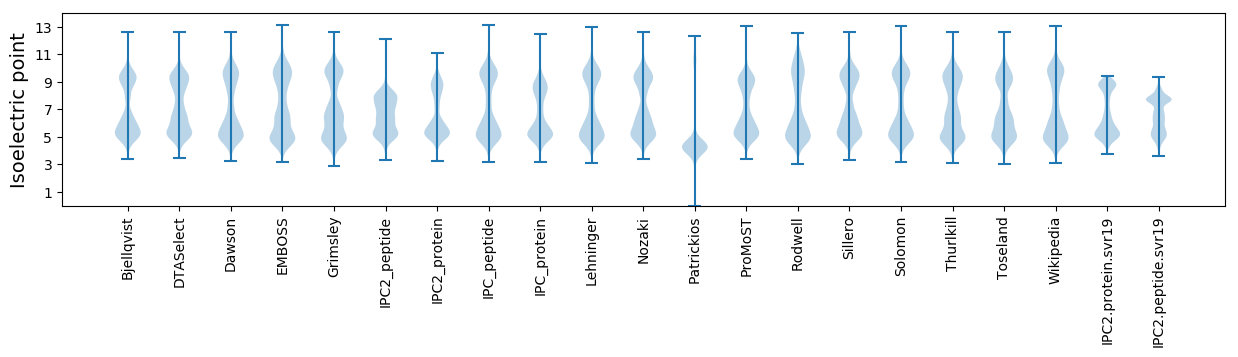
* You can choose from 21 different methods for calculating isoelectric point
Summary statistics related to proteome-wise predictions
Protein with the lowest isoelectric point:
>tr|A0A6H3A920|A0A6H3A920_BACAN Cation-transporting ATPase E1-E2 family OS=Bacillus anthracis OX=1392 GN=GBAA_0405 PE=4 SV=1
MM1 pKa = 8.17DD2 pKa = 3.89KK3 pKa = 10.79QKK5 pKa = 11.1AIDD8 pKa = 4.26LLNSLEE14 pKa = 4.19IYY16 pKa = 10.5DD17 pKa = 4.03YY18 pKa = 11.58DD19 pKa = 4.87ADD21 pKa = 4.94GEE23 pKa = 4.25ILYY26 pKa = 10.39YY27 pKa = 11.16ALVKK31 pKa = 10.85LNEE34 pKa = 4.33DD35 pKa = 3.45SKK37 pKa = 11.73KK38 pKa = 10.78VIEE41 pKa = 4.26SLLPEE46 pKa = 3.79GVNFNEE52 pKa = 4.21GLDD55 pKa = 3.92DD56 pKa = 4.37KK57 pKa = 12.0GEE59 pKa = 4.23LFDD62 pKa = 3.69ITLFCWEE69 pKa = 3.92YY70 pKa = 11.66AEE72 pKa = 4.72WFNGDD77 pKa = 2.73QFMAEE82 pKa = 4.27EE83 pKa = 4.3PKK85 pKa = 10.59EE86 pKa = 4.34VYY88 pKa = 10.37CEE90 pKa = 4.3SNN92 pKa = 2.86
MM1 pKa = 8.17DD2 pKa = 3.89KK3 pKa = 10.79QKK5 pKa = 11.1AIDD8 pKa = 4.26LLNSLEE14 pKa = 4.19IYY16 pKa = 10.5DD17 pKa = 4.03YY18 pKa = 11.58DD19 pKa = 4.87ADD21 pKa = 4.94GEE23 pKa = 4.25ILYY26 pKa = 10.39YY27 pKa = 11.16ALVKK31 pKa = 10.85LNEE34 pKa = 4.33DD35 pKa = 3.45SKK37 pKa = 11.73KK38 pKa = 10.78VIEE41 pKa = 4.26SLLPEE46 pKa = 3.79GVNFNEE52 pKa = 4.21GLDD55 pKa = 3.92DD56 pKa = 4.37KK57 pKa = 12.0GEE59 pKa = 4.23LFDD62 pKa = 3.69ITLFCWEE69 pKa = 3.92YY70 pKa = 11.66AEE72 pKa = 4.72WFNGDD77 pKa = 2.73QFMAEE82 pKa = 4.27EE83 pKa = 4.3PKK85 pKa = 10.59EE86 pKa = 4.34VYY88 pKa = 10.37CEE90 pKa = 4.3SNN92 pKa = 2.86
Molecular weight: 10.73 kDa
Isoelectric point according different methods:
Protein with the highest isoelectric point:
>sp|Q81KZ0|PFKA_BACAN ATP-dependent 6-phosphofructokinase OS=Bacillus anthracis OX=1392 GN=pfkA PE=3 SV=1
MM1 pKa = 7.35KK2 pKa = 9.42RR3 pKa = 11.84TYY5 pKa = 10.34QPNKK9 pKa = 8.21RR10 pKa = 11.84KK11 pKa = 9.62RR12 pKa = 11.84SKK14 pKa = 9.59VHH16 pKa = 5.83GFRR19 pKa = 11.84SRR21 pKa = 11.84MSTANGRR28 pKa = 11.84KK29 pKa = 8.81VLAARR34 pKa = 11.84RR35 pKa = 11.84RR36 pKa = 11.84KK37 pKa = 8.81GRR39 pKa = 11.84KK40 pKa = 8.75VLSAA44 pKa = 4.05
MM1 pKa = 7.35KK2 pKa = 9.42RR3 pKa = 11.84TYY5 pKa = 10.34QPNKK9 pKa = 8.21RR10 pKa = 11.84KK11 pKa = 9.62RR12 pKa = 11.84SKK14 pKa = 9.59VHH16 pKa = 5.83GFRR19 pKa = 11.84SRR21 pKa = 11.84MSTANGRR28 pKa = 11.84KK29 pKa = 8.81VLAARR34 pKa = 11.84RR35 pKa = 11.84RR36 pKa = 11.84KK37 pKa = 8.81GRR39 pKa = 11.84KK40 pKa = 8.75VLSAA44 pKa = 4.05
Molecular weight: 5.17 kDa
Isoelectric point according different methods:
Peptides (in silico digests for buttom-up proteomics)
Below you can find in silico digests of the whole proteome with Trypsin, Chymotrypsin, Trypsin+LysC, LysN, ArgC proteases suitable for different mass spec machines.| Try ESI |
 |
|---|
| ChTry ESI |
|
|---|
| ArgC ESI |
|
|---|
| LysN ESI |
|
|---|
| TryLysC ESI |
|
|---|
| Try MALDI |
|
|---|
| ChTry MALDI |
|
|---|
| ArgC MALDI |
|
|---|
| LysN MALDI |
|
|---|
| TryLysC MALDI |
|
|---|
| Try LTQ |
|
|---|
| ChTry LTQ |
|
|---|
| ArgC LTQ |
|
|---|
| LysN LTQ |
|
|---|
| TryLysC LTQ |
|
|---|
| Try MSlow |
|
|---|
| ChTry MSlow |
|
|---|
| ArgC MSlow |
|
|---|
| LysN MSlow |
|
|---|
| TryLysC MSlow |
|
|---|
| Try MShigh |
|
|---|
| ChTry MShigh |
|
|---|
| ArgC MShigh |
|
|---|
| LysN MShigh |
|
|---|
| TryLysC MShigh |
|
|---|
General Statistics
Number of major isoforms |
Number of additional isoforms |
Number of all proteins |
Number of amino acids |
Min. Seq. Length |
Max. Seq. Length |
Avg. Seq. Length |
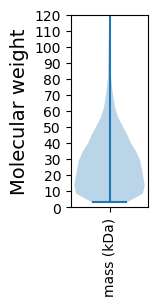
Avg. Mol. Weight |
|---|---|---|---|---|---|---|---|
1439306 |
28 |
5017 |
262.0 |
29.54 |
Amino acid frequency
Ala |
Cys |
Asp |
Glu |
Phe |
Gly |
His |
Ile |
Lys |
Leu |
|---|---|---|---|---|---|---|---|---|---|
6.695 ± 0.032 | 0.848 ± 0.011 |
4.658 ± 0.024 | 7.568 ± 0.05 |
4.69 ± 0.031 | 6.654 ± 0.035 |
2.122 ± 0.019 | 8.073 ± 0.041 |
7.465 ± 0.044 | 9.505 ± 0.044 |
Met |
Asn |
Gln |
Pro |
Arg |
Ser |
Thr |
Val |
Trp |
Tyr |
|---|---|---|---|---|---|---|---|---|---|
2.865 ± 0.017 | 4.621 ± 0.037 |
3.379 ± 0.025 | 3.701 ± 0.022 |
3.764 ± 0.028 | 5.794 ± 0.026 |
5.574 ± 0.047 | 7.252 ± 0.038 |
1.026 ± 0.013 | 3.747 ± 0.023 |
Most of the basic statistics you can see at this page can be downloaded from this CSV file
See this proteome in:

Proteome-pI is available under Creative Commons Attribution-NoDerivs license, for more details see here
| Reference: Kozlowski LP. Proteome-pI 2.0: Proteome Isoelectric Point Database Update. Nucleic Acids Res. 2021, doi: 10.1093/nar/gkab944 | Contact: Lukasz P. Kozlowski |