Acidovorax citrulli (strain AAC00-1) (Acidovorax avenae subsp. citrulli)
Taxonomy: cellular organisms; Bacteria; Proteobacteria; Betaproteobacteria; Burkholderiales; Comamonadaceae; Acidovorax; Acidovorax citrulli
Average proteome isoelectric point is 7.03
Get precalculated fractions of proteins

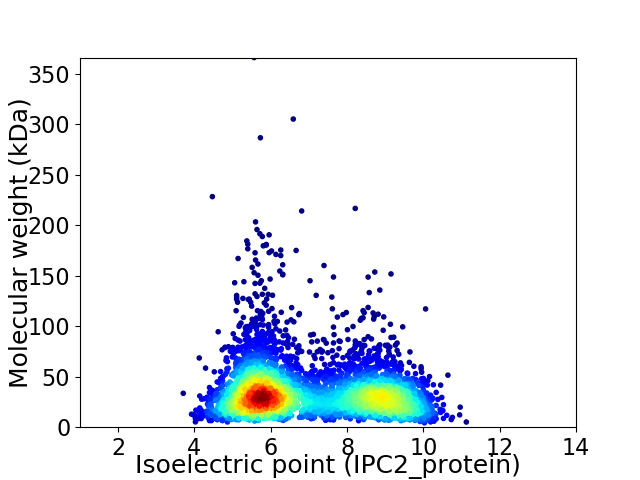
Virtual 2D-PAGE plot for 4602 proteins (isoelectric point calculated using IPC2_protein)
Get csv file with sequences according to given criteria:
* You can choose from 21 different methods for calculating isoelectric point
Summary statistics related to proteome-wise predictions


Protein with the lowest isoelectric point:
>tr|A1TUF9|A1TUF9_ACIAC Endolytic peptidoglycan transglycosylase RlpA OS=Acidovorax citrulli (strain AAC00-1) OX=397945 GN=rlpA PE=3 SV=1
MM1 pKa = 7.25SAVAEE6 pKa = 4.41NIQTEE11 pKa = 4.49MPAPIVFTDD20 pKa = 3.68SAAAKK25 pKa = 10.02VADD28 pKa = 5.45LIAEE32 pKa = 4.31EE33 pKa = 4.82GNPDD37 pKa = 2.99LKK39 pKa = 11.13LRR41 pKa = 11.84VFVQGGGCSGFQYY54 pKa = 10.94GFTFDD59 pKa = 4.81EE60 pKa = 4.64ITNEE64 pKa = 4.77DD65 pKa = 4.2DD66 pKa = 3.25TTMTKK71 pKa = 10.66NGVSLLIDD79 pKa = 3.54AMSYY83 pKa = 10.32QYY85 pKa = 11.5LVGAEE90 pKa = 3.79IDD92 pKa = 3.91YY93 pKa = 11.36KK94 pKa = 11.19EE95 pKa = 4.67DD96 pKa = 3.23LQGAQFVIKK105 pKa = 10.4NPNATTTCGCGSSFSVV121 pKa = 3.54
MM1 pKa = 7.25SAVAEE6 pKa = 4.41NIQTEE11 pKa = 4.49MPAPIVFTDD20 pKa = 3.68SAAAKK25 pKa = 10.02VADD28 pKa = 5.45LIAEE32 pKa = 4.31EE33 pKa = 4.82GNPDD37 pKa = 2.99LKK39 pKa = 11.13LRR41 pKa = 11.84VFVQGGGCSGFQYY54 pKa = 10.94GFTFDD59 pKa = 4.81EE60 pKa = 4.64ITNEE64 pKa = 4.77DD65 pKa = 4.2DD66 pKa = 3.25TTMTKK71 pKa = 10.66NGVSLLIDD79 pKa = 3.54AMSYY83 pKa = 10.32QYY85 pKa = 11.5LVGAEE90 pKa = 3.79IDD92 pKa = 3.91YY93 pKa = 11.36KK94 pKa = 11.19EE95 pKa = 4.67DD96 pKa = 3.23LQGAQFVIKK105 pKa = 10.4NPNATTTCGCGSSFSVV121 pKa = 3.54
Molecular weight: 12.91 kDa
Isoelectric point according different methods:
Protein with the highest isoelectric point:
>tr|A1TPI5|A1TPI5_ACIAC Uncharacterized protein OS=Acidovorax citrulli (strain AAC00-1) OX=397945 GN=Aave_2295 PE=4 SV=1
MM1 pKa = 7.56GPGPLRR7 pKa = 11.84SRR9 pKa = 11.84AQRR12 pKa = 11.84QARR15 pKa = 11.84HH16 pKa = 5.85AARR19 pKa = 11.84HH20 pKa = 4.71LQRR23 pKa = 11.84PGPHH27 pKa = 6.64AFRR30 pKa = 11.84RR31 pKa = 11.84SARR34 pKa = 11.84GWFRR38 pKa = 11.84LHH40 pKa = 6.98RR41 pKa = 11.84PRR43 pKa = 11.84PHH45 pKa = 7.12GGRR48 pKa = 11.84QRR50 pKa = 11.84GAGGQHH56 pKa = 6.39PAARR60 pKa = 11.84GHH62 pKa = 6.66PWTGGRR68 pKa = 11.84AGRR71 pKa = 11.84PGGVRR76 pKa = 11.84GRR78 pKa = 11.84QGRR81 pKa = 11.84EE82 pKa = 3.7GEE84 pKa = 3.88AGGWRR89 pKa = 11.84RR90 pKa = 11.84HH91 pKa = 5.24GLQEE95 pKa = 3.89FNRR98 pKa = 11.84WRR100 pKa = 11.84AAPVRR105 pKa = 11.84VGPPVV110 pKa = 2.97
MM1 pKa = 7.56GPGPLRR7 pKa = 11.84SRR9 pKa = 11.84AQRR12 pKa = 11.84QARR15 pKa = 11.84HH16 pKa = 5.85AARR19 pKa = 11.84HH20 pKa = 4.71LQRR23 pKa = 11.84PGPHH27 pKa = 6.64AFRR30 pKa = 11.84RR31 pKa = 11.84SARR34 pKa = 11.84GWFRR38 pKa = 11.84LHH40 pKa = 6.98RR41 pKa = 11.84PRR43 pKa = 11.84PHH45 pKa = 7.12GGRR48 pKa = 11.84QRR50 pKa = 11.84GAGGQHH56 pKa = 6.39PAARR60 pKa = 11.84GHH62 pKa = 6.66PWTGGRR68 pKa = 11.84AGRR71 pKa = 11.84PGGVRR76 pKa = 11.84GRR78 pKa = 11.84QGRR81 pKa = 11.84EE82 pKa = 3.7GEE84 pKa = 3.88AGGWRR89 pKa = 11.84RR90 pKa = 11.84HH91 pKa = 5.24GLQEE95 pKa = 3.89FNRR98 pKa = 11.84WRR100 pKa = 11.84AAPVRR105 pKa = 11.84VGPPVV110 pKa = 2.97
Molecular weight: 12.2 kDa
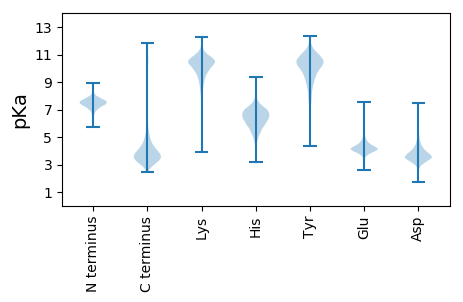
Isoelectric point according different methods:
Peptides (in silico digests for buttom-up proteomics)
Below you can find in silico digests of the whole proteome with Trypsin, Chymotrypsin, Trypsin+LysC, LysN, ArgC proteases suitable for different mass spec machines.| Try ESI |
 |
|---|
| ChTry ESI |
 |
|---|
| ArgC ESI |
 |
|---|
| LysN ESI |
 |
|---|
| TryLysC ESI |
 |
|---|
| Try MALDI |
 |
|---|
| ChTry MALDI |
 |
|---|
| ArgC MALDI |
 |
|---|
| LysN MALDI |
 |
|---|
| TryLysC MALDI |
 |
|---|
| Try LTQ |
 |
|---|
| ChTry LTQ |
 |
|---|
| ArgC LTQ |
 |
|---|
| LysN LTQ |
 |
|---|
| TryLysC LTQ |
 |
|---|
| Try MSlow |
 |
|---|
| ChTry MSlow |
 |
|---|
| ArgC MSlow |
 |
|---|
| LysN MSlow |
 |
|---|
| TryLysC MSlow |
 |
|---|
| Try MShigh |
 |
|---|
| ChTry MShigh |
 |
|---|
| ArgC MShigh |
 |
|---|
| LysN MShigh |
 |
|---|
| TryLysC MShigh |
 |
|---|
General Statistics
Number of major isoforms |
Number of additional isoforms |
Number of all proteins |
Number of amino acids |
Min. Seq. Length |
Max. Seq. Length |
Avg. Seq. Length |
Avg. Mol. Weight |
|---|---|---|---|---|---|---|---|
0 |
1557338 |
37 |
3401 |
338.4 |
36.54 |
Amino acid frequency
Ala |
Cys |
Asp |
Glu |
Phe |
Gly |
His |
Ile |
Lys |
Leu |
|---|---|---|---|---|---|---|---|---|---|
13.853 ± 0.046 | 0.95 ± 0.012 |
5.193 ± 0.023 | 5.242 ± 0.032 |
3.258 ± 0.024 | 8.787 ± 0.036 |
2.357 ± 0.019 | 3.891 ± 0.023 |
2.672 ± 0.034 | 10.341 ± 0.045 |
Met |
Asn |
Gln |
Pro |
Arg |
Ser |
Thr |
Val |
Trp |
Tyr |
|---|---|---|---|---|---|---|---|---|---|
2.361 ± 0.015 | 2.242 ± 0.02 |
5.814 ± 0.033 | 4.079 ± 0.024 |
7.681 ± 0.034 | 5.197 ± 0.027 |
5.011 ± 0.028 | 7.433 ± 0.028 |
1.526 ± 0.015 | 2.113 ± 0.016 |
Most of the basic statistics you can see at this page can be downloaded from this CSV file
Proteome-pI is available under Creative Commons Attribution-NoDerivs license, for more details see here
| Reference: Kozlowski LP. Proteome-pI 2.0: Proteome Isoelectric Point Database Update. Nucleic Acids Res. 2021, doi: 10.1093/nar/gkab944 | Contact: Lukasz P. Kozlowski |
