Bovine adenovirus 2 (BAdV-2) (Mastadenovirus bos2)
Taxonomy: Viruses; Varidnaviria; Bamfordvirae; Preplasmiviricota; Tectiliviricetes; Rowavirales; Adenoviridae; Mastadenovirus; Ovine mastadenovirus A
Average proteome isoelectric point is 6.28
Get precalculated fractions of proteins

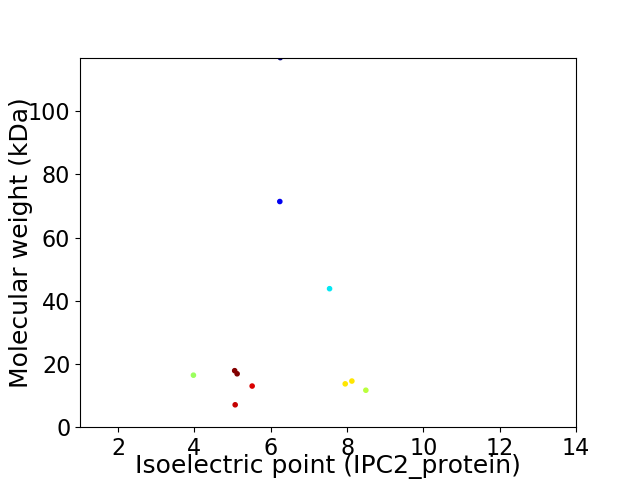
Virtual 2D-PAGE plot for 11 proteins (isoelectric point calculated using IPC2_protein)
Get csv file with sequences according to given criteria:
* You can choose from 21 different methods for calculating isoelectric point
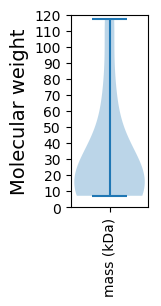
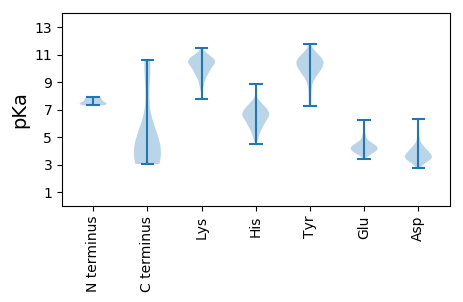
Summary statistics related to proteome-wise predictions


Protein with the lowest isoelectric point:
>tr|Q9EEG3|Q9EEG3_ADEB2 Uncharacterized protein OS=Bovine adenovirus 2 OX=114429 PE=4 SV=1
MM1 pKa = 7.46RR2 pKa = 11.84HH3 pKa = 5.85LRR5 pKa = 11.84LAFDD9 pKa = 3.22WRR11 pKa = 11.84FWEE14 pKa = 4.17AAEE17 pKa = 5.16NLLQDD22 pKa = 3.86LHH24 pKa = 6.74TSEE27 pKa = 6.25DD28 pKa = 3.66EE29 pKa = 4.41DD30 pKa = 3.91EE31 pKa = 5.15GFSEE35 pKa = 5.07PLTLQDD41 pKa = 4.24LVEE44 pKa = 4.58LEE46 pKa = 4.42SPNAVDD52 pKa = 5.19YY53 pKa = 8.16FFPDD57 pKa = 2.92ADD59 pKa = 4.04IPQEE63 pKa = 4.2LPTDD67 pKa = 3.86AAAEE71 pKa = 4.0EE72 pKa = 4.43LLGCDD77 pKa = 3.64EE78 pKa = 4.56VVDD81 pKa = 5.33LSTLFDD87 pKa = 4.09SEE89 pKa = 5.41AEE91 pKa = 4.24STPNSPFSAVEE102 pKa = 3.53LDD104 pKa = 3.97YY105 pKa = 11.21PEE107 pKa = 5.72HH108 pKa = 7.03PGHH111 pKa = 7.19DD112 pKa = 3.88CSACDD117 pKa = 3.36YY118 pKa = 10.73HH119 pKa = 8.85RR120 pKa = 11.84RR121 pKa = 11.84ATKK124 pKa = 10.82NEE126 pKa = 3.75DD127 pKa = 3.82TLCSLCYY134 pKa = 9.66MRR136 pKa = 11.84QNAFAVYY143 pKa = 9.92GKK145 pKa = 10.59
MM1 pKa = 7.46RR2 pKa = 11.84HH3 pKa = 5.85LRR5 pKa = 11.84LAFDD9 pKa = 3.22WRR11 pKa = 11.84FWEE14 pKa = 4.17AAEE17 pKa = 5.16NLLQDD22 pKa = 3.86LHH24 pKa = 6.74TSEE27 pKa = 6.25DD28 pKa = 3.66EE29 pKa = 4.41DD30 pKa = 3.91EE31 pKa = 5.15GFSEE35 pKa = 5.07PLTLQDD41 pKa = 4.24LVEE44 pKa = 4.58LEE46 pKa = 4.42SPNAVDD52 pKa = 5.19YY53 pKa = 8.16FFPDD57 pKa = 2.92ADD59 pKa = 4.04IPQEE63 pKa = 4.2LPTDD67 pKa = 3.86AAAEE71 pKa = 4.0EE72 pKa = 4.43LLGCDD77 pKa = 3.64EE78 pKa = 4.56VVDD81 pKa = 5.33LSTLFDD87 pKa = 4.09SEE89 pKa = 5.41AEE91 pKa = 4.24STPNSPFSAVEE102 pKa = 3.53LDD104 pKa = 3.97YY105 pKa = 11.21PEE107 pKa = 5.72HH108 pKa = 7.03PGHH111 pKa = 7.19DD112 pKa = 3.88CSACDD117 pKa = 3.36YY118 pKa = 10.73HH119 pKa = 8.85RR120 pKa = 11.84RR121 pKa = 11.84ATKK124 pKa = 10.82NEE126 pKa = 3.75DD127 pKa = 3.82TLCSLCYY134 pKa = 9.66MRR136 pKa = 11.84QNAFAVYY143 pKa = 9.92GKK145 pKa = 10.59
Molecular weight: 16.47 kDa
Isoelectric point according different methods:
Protein with the highest isoelectric point:
>sp|Q89592|CAP8_ADEB2 Pre-hexon-linking protein VIII OS=Bovine adenovirus 2 OX=114429 GN=L4 PE=3 SV=2
MM1 pKa = 7.51TFAQDD6 pKa = 2.97EE7 pKa = 4.38ALIQTTATNYY17 pKa = 8.56MLLYY21 pKa = 10.37VIIFMMLKK29 pKa = 9.71VKK31 pKa = 9.25KK32 pKa = 8.75TFYY35 pKa = 10.74LWLFVVGVCGDD46 pKa = 2.82IHH48 pKa = 7.52ISKK51 pKa = 10.49FEE53 pKa = 3.99HH54 pKa = 7.05EE55 pKa = 4.31YY56 pKa = 11.23AQLDD60 pKa = 3.96FNATNWTEE68 pKa = 3.87ASWYY72 pKa = 10.21KK73 pKa = 10.85LYY75 pKa = 10.16TGKK78 pKa = 10.54IINFGANLGNVNKK91 pKa = 10.47NKK93 pKa = 9.74ACRR96 pKa = 11.84VFRR99 pKa = 11.84KK100 pKa = 9.94
MM1 pKa = 7.51TFAQDD6 pKa = 2.97EE7 pKa = 4.38ALIQTTATNYY17 pKa = 8.56MLLYY21 pKa = 10.37VIIFMMLKK29 pKa = 9.71VKK31 pKa = 9.25KK32 pKa = 8.75TFYY35 pKa = 10.74LWLFVVGVCGDD46 pKa = 2.82IHH48 pKa = 7.52ISKK51 pKa = 10.49FEE53 pKa = 3.99HH54 pKa = 7.05EE55 pKa = 4.31YY56 pKa = 11.23AQLDD60 pKa = 3.96FNATNWTEE68 pKa = 3.87ASWYY72 pKa = 10.21KK73 pKa = 10.85LYY75 pKa = 10.16TGKK78 pKa = 10.54IINFGANLGNVNKK91 pKa = 10.47NKK93 pKa = 9.74ACRR96 pKa = 11.84VFRR99 pKa = 11.84KK100 pKa = 9.94
Molecular weight: 11.7 kDa
Isoelectric point according different methods:
Peptides (in silico digests for buttom-up proteomics)
Below you can find in silico digests of the whole proteome with Trypsin, Chymotrypsin, Trypsin+LysC, LysN, ArgC proteases suitable for different mass spec machines.| Try ESI |
 |
|---|
| ChTry ESI |
 |
|---|
| ArgC ESI |
 |
|---|
| LysN ESI |
 |
|---|
| TryLysC ESI |
 |
|---|
| Try MALDI |
 |
|---|
| ChTry MALDI |
 |
|---|
| ArgC MALDI |
 |
|---|
| LysN MALDI |
 |
|---|
| TryLysC MALDI |
 |
|---|
| Try LTQ |
 |
|---|
| ChTry LTQ |
 |
|---|
| ArgC LTQ |
 |
|---|
| LysN LTQ |
 |
|---|
| TryLysC LTQ |
 |
|---|
| Try MSlow |
 |
|---|
| ChTry MSlow |
 |
|---|
| ArgC MSlow |
 |
|---|
| LysN MSlow |
 |
|---|
| TryLysC MSlow |
 |
|---|
| Try MShigh |
 |
|---|
| ChTry MShigh |
 |
|---|
| ArgC MShigh |
 |
|---|
| LysN MShigh |
 |
|---|
| TryLysC MShigh |
 |
|---|
General Statistics
Number of major isoforms |
Number of additional isoforms |
Number of all proteins |
Number of amino acids |
Min. Seq. Length |
Max. Seq. Length |
Avg. Seq. Length |
Avg. Mol. Weight |
|---|---|---|---|---|---|---|---|
0 |
3019 |
63 |
1017 |
274.5 |
31.25 |
Amino acid frequency
Ala |
Cys |
Asp |
Glu |
Phe |
Gly |
His |
Ile |
Lys |
Leu |
|---|---|---|---|---|---|---|---|---|---|
7.055 ± 0.471 | 2.749 ± 0.585 |
4.737 ± 0.581 | 6.691 ± 0.494 |
5.399 ± 0.407 | 4.969 ± 0.722 |
2.517 ± 0.314 | 6.028 ± 0.621 |
4.803 ± 0.936 | 9.573 ± 0.551 |
Met |
Asn |
Gln |
Pro |
Arg |
Ser |
Thr |
Val |
Trp |
Tyr |
|---|---|---|---|---|---|---|---|---|---|
1.954 ± 0.236 | 5.2 ± 0.364 |
4.737 ± 0.528 | 4.439 ± 0.578 |
5.73 ± 0.861 | 7.022 ± 0.706 |
5.631 ± 0.439 | 5.697 ± 0.502 |
1.491 ± 0.249 | 3.577 ± 0.304 |
Most of the basic statistics you can see at this page can be downloaded from this CSV file
Proteome-pI is available under Creative Commons Attribution-NoDerivs license, for more details see here
| Reference: Kozlowski LP. Proteome-pI 2.0: Proteome Isoelectric Point Database Update. Nucleic Acids Res. 2021, doi: 10.1093/nar/gkab944 | Contact: Lukasz P. Kozlowski |
