Acidipila sp. EB88
Taxonomy: cellular organisms; Bacteria; Acidobacteria; Acidobacteriia; Acidobacteriales; Acidobacteriaceae; Acidipila; unclassified Acidipila
Average proteome isoelectric point is 6.67
Get precalculated fractions of proteins

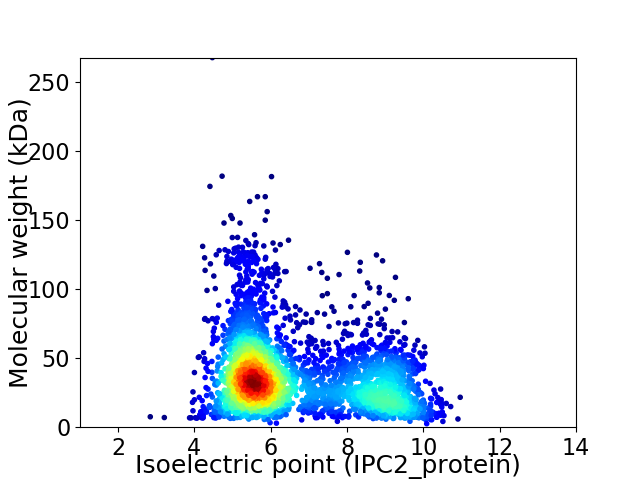
Virtual 2D-PAGE plot for 3402 proteins (isoelectric point calculated using IPC2_protein)
Get csv file with sequences according to given criteria:
* You can choose from 21 different methods for calculating isoelectric point
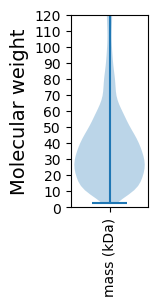
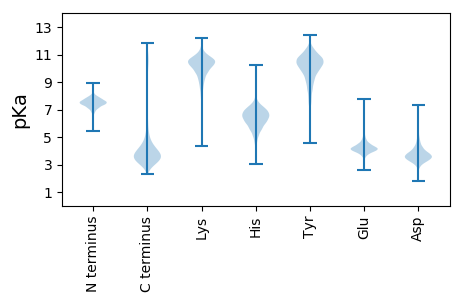
Summary statistics related to proteome-wise predictions


Protein with the lowest isoelectric point:
>tr|A0A3P0XA44|A0A3P0XA44_9BACT Glycosyltransferase OS=Acidipila sp. EB88 OX=2305226 GN=D1Y84_14980 PE=4 SV=1
MM1 pKa = 7.51TSQEE5 pKa = 3.86QAMLNDD11 pKa = 4.34LVHH14 pKa = 7.07KK15 pKa = 10.55INSTNLEE22 pKa = 4.15EE23 pKa = 5.56KK24 pKa = 10.68DD25 pKa = 3.69DD26 pKa = 4.17AAEE29 pKa = 3.77QLLRR33 pKa = 11.84DD34 pKa = 3.81GLGRR38 pKa = 11.84NQDD41 pKa = 3.87ALYY44 pKa = 10.04MLAQTVLVQNIALEE58 pKa = 4.1QAKK61 pKa = 9.1QQLMQMQQAPAAPAKK76 pKa = 9.19ATSFLGSLLGHH87 pKa = 7.36RR88 pKa = 11.84DD89 pKa = 3.98PQPQAPPPQQQGGYY103 pKa = 7.3QQVQYY108 pKa = 10.55GQPQYY113 pKa = 11.21AQPQYY118 pKa = 10.71AQPQGGFAPPPSGQPSFLRR137 pKa = 11.84SAATTAAGVAAGALAFQGVEE157 pKa = 4.21SLLHH161 pKa = 6.41GGMGGGGGFGGEE173 pKa = 4.36GFGGGGFGGGEE184 pKa = 3.96APRR187 pKa = 11.84EE188 pKa = 3.86EE189 pKa = 5.05IINNYY194 pKa = 8.89YY195 pKa = 10.61DD196 pKa = 3.66SPGGGSGGGNYY207 pKa = 10.08NSGPDD212 pKa = 3.92EE213 pKa = 4.16QPQGPFDD220 pKa = 4.03SGSNDD225 pKa = 2.74ASYY228 pKa = 11.73GDD230 pKa = 5.4DD231 pKa = 3.71YY232 pKa = 11.61TDD234 pKa = 3.45GGGDD238 pKa = 3.66FGGDD242 pKa = 3.37DD243 pKa = 4.11DD244 pKa = 5.5TNFSS248 pKa = 3.71
MM1 pKa = 7.51TSQEE5 pKa = 3.86QAMLNDD11 pKa = 4.34LVHH14 pKa = 7.07KK15 pKa = 10.55INSTNLEE22 pKa = 4.15EE23 pKa = 5.56KK24 pKa = 10.68DD25 pKa = 3.69DD26 pKa = 4.17AAEE29 pKa = 3.77QLLRR33 pKa = 11.84DD34 pKa = 3.81GLGRR38 pKa = 11.84NQDD41 pKa = 3.87ALYY44 pKa = 10.04MLAQTVLVQNIALEE58 pKa = 4.1QAKK61 pKa = 9.1QQLMQMQQAPAAPAKK76 pKa = 9.19ATSFLGSLLGHH87 pKa = 7.36RR88 pKa = 11.84DD89 pKa = 3.98PQPQAPPPQQQGGYY103 pKa = 7.3QQVQYY108 pKa = 10.55GQPQYY113 pKa = 11.21AQPQYY118 pKa = 10.71AQPQGGFAPPPSGQPSFLRR137 pKa = 11.84SAATTAAGVAAGALAFQGVEE157 pKa = 4.21SLLHH161 pKa = 6.41GGMGGGGGFGGEE173 pKa = 4.36GFGGGGFGGGEE184 pKa = 3.96APRR187 pKa = 11.84EE188 pKa = 3.86EE189 pKa = 5.05IINNYY194 pKa = 8.89YY195 pKa = 10.61DD196 pKa = 3.66SPGGGSGGGNYY207 pKa = 10.08NSGPDD212 pKa = 3.92EE213 pKa = 4.16QPQGPFDD220 pKa = 4.03SGSNDD225 pKa = 2.74ASYY228 pKa = 11.73GDD230 pKa = 5.4DD231 pKa = 3.71YY232 pKa = 11.61TDD234 pKa = 3.45GGGDD238 pKa = 3.66FGGDD242 pKa = 3.37DD243 pKa = 4.11DD244 pKa = 5.5TNFSS248 pKa = 3.71
Molecular weight: 25.55 kDa
Isoelectric point according different methods:
Protein with the highest isoelectric point:
>tr|A0A3P0X897|A0A3P0X897_9BACT Energy transducer TonB OS=Acidipila sp. EB88 OX=2305226 GN=D1Y84_08775 PE=3 SV=1
MM1 pKa = 8.0PKK3 pKa = 9.02RR4 pKa = 11.84TFQPNRR10 pKa = 11.84RR11 pKa = 11.84HH12 pKa = 5.69RR13 pKa = 11.84AKK15 pKa = 9.37THH17 pKa = 5.09GFRR20 pKa = 11.84TRR22 pKa = 11.84MKK24 pKa = 8.84TNSGAAVLNRR34 pKa = 11.84RR35 pKa = 11.84RR36 pKa = 11.84AKK38 pKa = 10.03GRR40 pKa = 11.84HH41 pKa = 5.72KK42 pKa = 10.29IAVSAGFRR50 pKa = 11.84DD51 pKa = 3.66
MM1 pKa = 8.0PKK3 pKa = 9.02RR4 pKa = 11.84TFQPNRR10 pKa = 11.84RR11 pKa = 11.84HH12 pKa = 5.69RR13 pKa = 11.84AKK15 pKa = 9.37THH17 pKa = 5.09GFRR20 pKa = 11.84TRR22 pKa = 11.84MKK24 pKa = 8.84TNSGAAVLNRR34 pKa = 11.84RR35 pKa = 11.84RR36 pKa = 11.84AKK38 pKa = 10.03GRR40 pKa = 11.84HH41 pKa = 5.72KK42 pKa = 10.29IAVSAGFRR50 pKa = 11.84DD51 pKa = 3.66
Molecular weight: 5.93 kDa
Isoelectric point according different methods:
Peptides (in silico digests for buttom-up proteomics)
Below you can find in silico digests of the whole proteome with Trypsin, Chymotrypsin, Trypsin+LysC, LysN, ArgC proteases suitable for different mass spec machines.| Try ESI |
 |
|---|
| ChTry ESI |
 |
|---|
| ArgC ESI |
 |
|---|
| LysN ESI |
 |
|---|
| TryLysC ESI |
 |
|---|
| Try MALDI |
 |
|---|
| ChTry MALDI |
 |
|---|
| ArgC MALDI |
 |
|---|
| LysN MALDI |
 |
|---|
| TryLysC MALDI |
 |
|---|
| Try LTQ |
 |
|---|
| ChTry LTQ |
 |
|---|
| ArgC LTQ |
 |
|---|
| LysN LTQ |
 |
|---|
| TryLysC LTQ |
 |
|---|
| Try MSlow |
 |
|---|
| ChTry MSlow |
 |
|---|
| ArgC MSlow |
 |
|---|
| LysN MSlow |
 |
|---|
| TryLysC MSlow |
 |
|---|
| Try MShigh |
 |
|---|
| ChTry MShigh |
 |
|---|
| ArgC MShigh |
 |
|---|
| LysN MShigh |
 |
|---|
| TryLysC MShigh |
 |
|---|
General Statistics
Number of major isoforms |
Number of additional isoforms |
Number of all proteins |
Number of amino acids |
Min. Seq. Length |
Max. Seq. Length |
Avg. Seq. Length |
Avg. Mol. Weight |
|---|---|---|---|---|---|---|---|
0 |
1244068 |
23 |
2741 |
365.7 |
39.69 |
Amino acid frequency
Ala |
Cys |
Asp |
Glu |
Phe |
Gly |
His |
Ile |
Lys |
Leu |
|---|---|---|---|---|---|---|---|---|---|
12.185 ± 0.052 | 0.885 ± 0.014 |
4.92 ± 0.03 | 5.318 ± 0.042 |
3.709 ± 0.028 | 8.166 ± 0.044 |
2.453 ± 0.022 | 4.301 ± 0.028 |
2.988 ± 0.027 | 10.369 ± 0.062 |
Met |
Asn |
Gln |
Pro |
Arg |
Ser |
Thr |
Val |
Trp |
Tyr |
|---|---|---|---|---|---|---|---|---|---|
2.089 ± 0.021 | 3.033 ± 0.044 |
5.588 ± 0.031 | 4.087 ± 0.027 |
6.458 ± 0.049 | 6.188 ± 0.038 |
6.048 ± 0.046 | 7.204 ± 0.036 |
1.377 ± 0.02 | 2.635 ± 0.025 |
Most of the basic statistics you can see at this page can be downloaded from this CSV file
Proteome-pI is available under Creative Commons Attribution-NoDerivs license, for more details see here
| Reference: Kozlowski LP. Proteome-pI 2.0: Proteome Isoelectric Point Database Update. Nucleic Acids Res. 2021, doi: 10.1093/nar/gkab944 | Contact: Lukasz P. Kozlowski |
