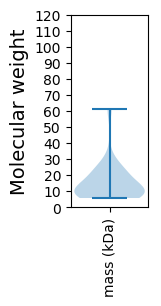
Streptococcus satellite phage Javan89
Taxonomy: Viruses; unclassified bacterial viruses
Average proteome isoelectric point is 6.2
Get precalculated fractions of proteins

Virtual 2D-PAGE plot for 27 proteins (isoelectric point calculated using IPC2_protein)
Get csv file with sequences according to given criteria:
* You can choose from 21 different methods for calculating isoelectric point
Summary statistics related to proteome-wise predictions


Protein with the lowest isoelectric point:
>tr|A0A4D6A1K4|A0A4D6A1K4_9VIRU ArpU family encoded transcriptional regulator OS=Streptococcus satellite phage Javan89 OX=2558866 GN=JavanS89_0003 PE=4 SV=1
MM1 pKa = 6.67MQEE4 pKa = 4.55LNLTPTQTLILFIVLGLVGLLLSLSKK30 pKa = 10.47PLIEE34 pKa = 5.57IDD36 pKa = 4.32LPEE39 pKa = 4.55DD40 pKa = 3.66TQVPKK45 pKa = 10.6PPQNANYY52 pKa = 9.61GAYY55 pKa = 9.23IQSQNHH61 pKa = 5.87YY62 pKa = 9.82YY63 pKa = 10.4NN64 pKa = 3.73
MM1 pKa = 6.67MQEE4 pKa = 4.55LNLTPTQTLILFIVLGLVGLLLSLSKK30 pKa = 10.47PLIEE34 pKa = 5.57IDD36 pKa = 4.32LPEE39 pKa = 4.55DD40 pKa = 3.66TQVPKK45 pKa = 10.6PPQNANYY52 pKa = 9.61GAYY55 pKa = 9.23IQSQNHH61 pKa = 5.87YY62 pKa = 9.82YY63 pKa = 10.4NN64 pKa = 3.73
Molecular weight: 7.21 kDa
Isoelectric point according different methods:
Protein with the highest isoelectric point:
>tr|A0A4D5ZXF3|A0A4D5ZXF3_9VIRU Uncharacterized protein OS=Streptococcus satellite phage Javan89 OX=2558866 GN=JavanS89_0001 PE=4 SV=1
MM1 pKa = 7.61NIKK4 pKa = 9.82EE5 pKa = 4.16YY6 pKa = 10.51KK7 pKa = 9.44KK8 pKa = 10.5KK9 pKa = 10.71NGTIVYY15 pKa = 7.42RR16 pKa = 11.84TSVYY20 pKa = 10.7LGVDD24 pKa = 2.96QVTGKK29 pKa = 10.41KK30 pKa = 10.32ARR32 pKa = 11.84TTITASTKK40 pKa = 10.32KK41 pKa = 10.14GVKK44 pKa = 9.43IKK46 pKa = 10.92ARR48 pKa = 11.84DD49 pKa = 3.59ALNNFAMNGYY59 pKa = 6.25TVKK62 pKa = 10.52EE63 pKa = 4.27KK64 pKa = 9.63PTVTTYY70 pKa = 11.25KK71 pKa = 10.56EE72 pKa = 4.08LTALWWEE79 pKa = 4.56SYY81 pKa = 11.25KK82 pKa = 10.03NTIKK86 pKa = 10.76PNSRR90 pKa = 11.84QSMEE94 pKa = 4.4GIVRR98 pKa = 11.84LHH100 pKa = 6.69ILPAFGDD107 pKa = 4.16CKK109 pKa = 10.5LSRR112 pKa = 11.84LTTPVIQQQVNKK124 pKa = 8.75WANNANKK131 pKa = 10.06GIKK134 pKa = 9.07GAYY137 pKa = 9.42ANYY140 pKa = 10.79SFLNNINRR148 pKa = 11.84RR149 pKa = 11.84ILQYY153 pKa = 10.72GVTMQVIEE161 pKa = 4.63HH162 pKa = 6.18NPARR166 pKa = 11.84DD167 pKa = 3.48VIIPRR172 pKa = 11.84KK173 pKa = 9.5QNNKK177 pKa = 5.23EE178 pKa = 3.95HH179 pKa = 6.3KK180 pKa = 10.5VKK182 pKa = 10.63FFSNN186 pKa = 3.41
MM1 pKa = 7.61NIKK4 pKa = 9.82EE5 pKa = 4.16YY6 pKa = 10.51KK7 pKa = 9.44KK8 pKa = 10.5KK9 pKa = 10.71NGTIVYY15 pKa = 7.42RR16 pKa = 11.84TSVYY20 pKa = 10.7LGVDD24 pKa = 2.96QVTGKK29 pKa = 10.41KK30 pKa = 10.32ARR32 pKa = 11.84TTITASTKK40 pKa = 10.32KK41 pKa = 10.14GVKK44 pKa = 9.43IKK46 pKa = 10.92ARR48 pKa = 11.84DD49 pKa = 3.59ALNNFAMNGYY59 pKa = 6.25TVKK62 pKa = 10.52EE63 pKa = 4.27KK64 pKa = 9.63PTVTTYY70 pKa = 11.25KK71 pKa = 10.56EE72 pKa = 4.08LTALWWEE79 pKa = 4.56SYY81 pKa = 11.25KK82 pKa = 10.03NTIKK86 pKa = 10.76PNSRR90 pKa = 11.84QSMEE94 pKa = 4.4GIVRR98 pKa = 11.84LHH100 pKa = 6.69ILPAFGDD107 pKa = 4.16CKK109 pKa = 10.5LSRR112 pKa = 11.84LTTPVIQQQVNKK124 pKa = 8.75WANNANKK131 pKa = 10.06GIKK134 pKa = 9.07GAYY137 pKa = 9.42ANYY140 pKa = 10.79SFLNNINRR148 pKa = 11.84RR149 pKa = 11.84ILQYY153 pKa = 10.72GVTMQVIEE161 pKa = 4.63HH162 pKa = 6.18NPARR166 pKa = 11.84DD167 pKa = 3.48VIIPRR172 pKa = 11.84KK173 pKa = 9.5QNNKK177 pKa = 5.23EE178 pKa = 3.95HH179 pKa = 6.3KK180 pKa = 10.5VKK182 pKa = 10.63FFSNN186 pKa = 3.41
Molecular weight: 21.31 kDa
Isoelectric point according different methods:
Peptides (in silico digests for buttom-up proteomics)
Below you can find in silico digests of the whole proteome with Trypsin, Chymotrypsin, Trypsin+LysC, LysN, ArgC proteases suitable for different mass spec machines.| Try ESI |
 |
|---|
| ChTry ESI |
 |
|---|
| ArgC ESI |
 |
|---|
| LysN ESI |
 |
|---|
| TryLysC ESI |
 |
|---|
| Try MALDI |
 |
|---|
| ChTry MALDI |
 |
|---|
| ArgC MALDI |
 |
|---|
| LysN MALDI |
 |
|---|
| TryLysC MALDI |
 |
|---|
| Try LTQ |
 |
|---|
| ChTry LTQ |
 |
|---|
| ArgC LTQ |
 |
|---|
| LysN LTQ |
 |
|---|
| TryLysC LTQ |
 |
|---|
| Try MSlow |
 |
|---|
| ChTry MSlow |
 |
|---|
| ArgC MSlow |
 |
|---|
| LysN MSlow |
 |
|---|
| TryLysC MSlow |
 |
|---|
| Try MShigh |
 |
|---|
| ChTry MShigh |
 |
|---|
| ArgC MShigh |
 |
|---|
| LysN MShigh |
 |
|---|
| TryLysC MShigh |
 |
|---|
General Statistics
Number of major isoforms |
Number of additional isoforms |
Number of all proteins |
Number of amino acids |
Min. Seq. Length |
Max. Seq. Length |
Avg. Seq. Length |
Avg. Mol. Weight |
|---|---|---|---|---|---|---|---|
0 |
3494 |
48 |
534 |
129.4 |
15.02 |
Amino acid frequency
Ala |
Cys |
Asp |
Glu |
Phe |
Gly |
His |
Ile |
Lys |
Leu |
|---|---|---|---|---|---|---|---|---|---|
5.581 ± 0.651 | 0.515 ± 0.132 |
6.153 ± 0.54 | 8.615 ± 0.664 |
4.408 ± 0.411 | 4.408 ± 0.555 |
1.631 ± 0.192 | 7.041 ± 0.461 |
9.273 ± 0.381 | 9.502 ± 0.547 |
Met |
Asn |
Gln |
Pro |
Arg |
Ser |
Thr |
Val |
Trp |
Tyr |
|---|---|---|---|---|---|---|---|---|---|
2.576 ± 0.18 | 5.524 ± 0.468 |
2.318 ± 0.204 | 4.522 ± 0.266 |
4.694 ± 0.288 | 6.096 ± 0.341 |
5.781 ± 0.581 | 5.667 ± 0.385 |
0.973 ± 0.146 | 4.722 ± 0.267 |
Most of the basic statistics you can see at this page can be downloaded from this CSV file
Proteome-pI is available under Creative Commons Attribution-NoDerivs license, for more details see here
| Reference: Kozlowski LP. Proteome-pI 2.0: Proteome Isoelectric Point Database Update. Nucleic Acids Res. 2021, doi: 10.1093/nar/gkab944 | Contact: Lukasz P. Kozlowski |
