Erwinia phage phiEa21-4
Taxonomy: Viruses; Duplodnaviria; Heunggongvirae; Uroviricota; Caudoviricetes; Caudovirales; Myoviridae; Ounavirinae; Kolesnikvirus; Erwinia virus Ea214
Average proteome isoelectric point is 6.52
Get precalculated fractions of proteins

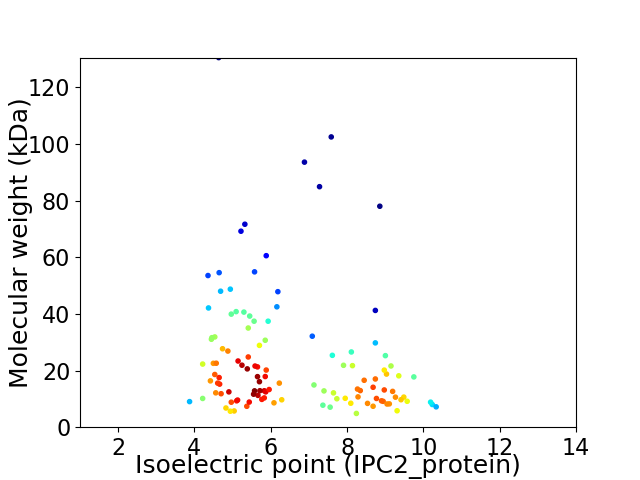
Virtual 2D-PAGE plot for 118 proteins (isoelectric point calculated using IPC2_protein)
Get csv file with sequences according to given criteria:
* You can choose from 21 different methods for calculating isoelectric point
Summary statistics related to proteome-wise predictions


Protein with the lowest isoelectric point:
>tr|B8QTS3|B8QTS3_9CAUD Hypothetical phage protein OS=Erwinia phage phiEa21-4 OX=557393 GN=25 PE=4 SV=1
MM1 pKa = 7.37LCVHH5 pKa = 6.44GTTLEE10 pKa = 4.03NFKK13 pKa = 10.87MMIANEE19 pKa = 4.32GKK21 pKa = 9.68PSGAWNVSEE30 pKa = 5.22CDD32 pKa = 3.09AATYY36 pKa = 8.16FYY38 pKa = 10.42PLDD41 pKa = 4.59KK42 pKa = 10.27IAKK45 pKa = 8.9AEE47 pKa = 4.08CLEE50 pKa = 4.53ADD52 pKa = 4.22DD53 pKa = 5.54FDD55 pKa = 5.92SEE57 pKa = 5.53SEE59 pKa = 4.19YY60 pKa = 11.19QDD62 pKa = 5.8AILQAAKK69 pKa = 10.12RR70 pKa = 11.84HH71 pKa = 5.09ARR73 pKa = 11.84GNAMTTAAIAEE84 pKa = 4.47RR85 pKa = 11.84DD86 pKa = 3.38TKK88 pKa = 11.13LIVFLADD95 pKa = 3.44VPEE98 pKa = 4.69HH99 pKa = 6.58LLEE102 pKa = 6.12DD103 pKa = 5.39DD104 pKa = 4.21YY105 pKa = 12.15SCDD108 pKa = 3.28NMADD112 pKa = 3.01IASFIHH118 pKa = 6.78EE119 pKa = 4.9DD120 pKa = 3.55DD121 pKa = 4.92FKK123 pKa = 11.77VEE125 pKa = 4.21MIQRR129 pKa = 11.84IWQYY133 pKa = 10.4SFFGIFSPYY142 pKa = 9.48CVQPDD147 pKa = 4.02NPYY150 pKa = 8.74MMSMSYY156 pKa = 10.36HH157 pKa = 6.65LEE159 pKa = 3.66QMARR163 pKa = 11.84AIQNSNAYY171 pKa = 10.37LYY173 pKa = 9.15DD174 pKa = 4.02TIEE177 pKa = 4.12NSLDD181 pKa = 3.28EE182 pKa = 4.78SEE184 pKa = 4.25EE185 pKa = 4.04QKK187 pKa = 11.24GLEE190 pKa = 3.86FLINII195 pKa = 4.85
MM1 pKa = 7.37LCVHH5 pKa = 6.44GTTLEE10 pKa = 4.03NFKK13 pKa = 10.87MMIANEE19 pKa = 4.32GKK21 pKa = 9.68PSGAWNVSEE30 pKa = 5.22CDD32 pKa = 3.09AATYY36 pKa = 8.16FYY38 pKa = 10.42PLDD41 pKa = 4.59KK42 pKa = 10.27IAKK45 pKa = 8.9AEE47 pKa = 4.08CLEE50 pKa = 4.53ADD52 pKa = 4.22DD53 pKa = 5.54FDD55 pKa = 5.92SEE57 pKa = 5.53SEE59 pKa = 4.19YY60 pKa = 11.19QDD62 pKa = 5.8AILQAAKK69 pKa = 10.12RR70 pKa = 11.84HH71 pKa = 5.09ARR73 pKa = 11.84GNAMTTAAIAEE84 pKa = 4.47RR85 pKa = 11.84DD86 pKa = 3.38TKK88 pKa = 11.13LIVFLADD95 pKa = 3.44VPEE98 pKa = 4.69HH99 pKa = 6.58LLEE102 pKa = 6.12DD103 pKa = 5.39DD104 pKa = 4.21YY105 pKa = 12.15SCDD108 pKa = 3.28NMADD112 pKa = 3.01IASFIHH118 pKa = 6.78EE119 pKa = 4.9DD120 pKa = 3.55DD121 pKa = 4.92FKK123 pKa = 11.77VEE125 pKa = 4.21MIQRR129 pKa = 11.84IWQYY133 pKa = 10.4SFFGIFSPYY142 pKa = 9.48CVQPDD147 pKa = 4.02NPYY150 pKa = 8.74MMSMSYY156 pKa = 10.36HH157 pKa = 6.65LEE159 pKa = 3.66QMARR163 pKa = 11.84AIQNSNAYY171 pKa = 10.37LYY173 pKa = 9.15DD174 pKa = 4.02TIEE177 pKa = 4.12NSLDD181 pKa = 3.28EE182 pKa = 4.78SEE184 pKa = 4.25EE185 pKa = 4.04QKK187 pKa = 11.24GLEE190 pKa = 3.86FLINII195 pKa = 4.85
Molecular weight: 22.28 kDa
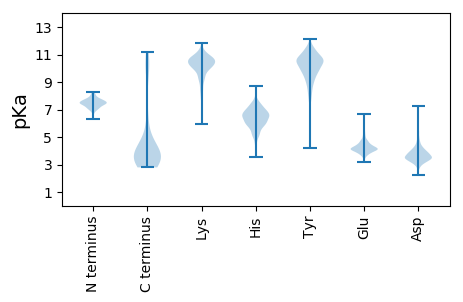
Isoelectric point according different methods:
Protein with the highest isoelectric point:
>tr|B8QTV5|B8QTV5_9CAUD Conserved structural protein OS=Erwinia phage phiEa21-4 OX=557393 GN=57 PE=4 SV=1
MM1 pKa = 6.97VKK3 pKa = 10.15RR4 pKa = 11.84VIGEE8 pKa = 3.88GRR10 pKa = 11.84NILMKK15 pKa = 10.38AVKK18 pKa = 10.11NIAKK22 pKa = 8.66STVKK26 pKa = 10.58VGFFAEE32 pKa = 4.2QGKK35 pKa = 9.81HH36 pKa = 4.7YY37 pKa = 11.04SGFSYY42 pKa = 9.78PALMYY47 pKa = 10.18LHH49 pKa = 6.91EE50 pKa = 4.36VHH52 pKa = 7.42GIPASNGKK60 pKa = 8.93VYY62 pKa = 10.59RR63 pKa = 11.84RR64 pKa = 11.84AFEE67 pKa = 3.69TAMQIDD73 pKa = 4.46RR74 pKa = 11.84KK75 pKa = 10.57LLIAQAQKK83 pKa = 10.66NLKK86 pKa = 10.12RR87 pKa = 11.84MLSTGQTNPDD97 pKa = 3.19LVLSQFGKK105 pKa = 10.66DD106 pKa = 3.44SIKK109 pKa = 10.66SLKK112 pKa = 10.17KK113 pKa = 10.29VFGNPSLLPPNTPSTIKK130 pKa = 10.81SKK132 pKa = 10.83GGRR135 pKa = 11.84NTPLVDD141 pKa = 3.7TSDD144 pKa = 4.05LVDD147 pKa = 3.34NLAYY151 pKa = 8.49KK152 pKa = 9.7TSNRR156 pKa = 11.84GGLRR160 pKa = 11.84KK161 pKa = 9.68
MM1 pKa = 6.97VKK3 pKa = 10.15RR4 pKa = 11.84VIGEE8 pKa = 3.88GRR10 pKa = 11.84NILMKK15 pKa = 10.38AVKK18 pKa = 10.11NIAKK22 pKa = 8.66STVKK26 pKa = 10.58VGFFAEE32 pKa = 4.2QGKK35 pKa = 9.81HH36 pKa = 4.7YY37 pKa = 11.04SGFSYY42 pKa = 9.78PALMYY47 pKa = 10.18LHH49 pKa = 6.91EE50 pKa = 4.36VHH52 pKa = 7.42GIPASNGKK60 pKa = 8.93VYY62 pKa = 10.59RR63 pKa = 11.84RR64 pKa = 11.84AFEE67 pKa = 3.69TAMQIDD73 pKa = 4.46RR74 pKa = 11.84KK75 pKa = 10.57LLIAQAQKK83 pKa = 10.66NLKK86 pKa = 10.12RR87 pKa = 11.84MLSTGQTNPDD97 pKa = 3.19LVLSQFGKK105 pKa = 10.66DD106 pKa = 3.44SIKK109 pKa = 10.66SLKK112 pKa = 10.17KK113 pKa = 10.29VFGNPSLLPPNTPSTIKK130 pKa = 10.81SKK132 pKa = 10.83GGRR135 pKa = 11.84NTPLVDD141 pKa = 3.7TSDD144 pKa = 4.05LVDD147 pKa = 3.34NLAYY151 pKa = 8.49KK152 pKa = 9.7TSNRR156 pKa = 11.84GGLRR160 pKa = 11.84KK161 pKa = 9.68
Molecular weight: 17.75 kDa
Isoelectric point according different methods:
Peptides (in silico digests for buttom-up proteomics)
Below you can find in silico digests of the whole proteome with Trypsin, Chymotrypsin, Trypsin+LysC, LysN, ArgC proteases suitable for different mass spec machines.| Try ESI |
 |
|---|
| ChTry ESI |
 |
|---|
| ArgC ESI |
 |
|---|
| LysN ESI |
 |
|---|
| TryLysC ESI |
 |
|---|
| Try MALDI |
 |
|---|
| ChTry MALDI |
 |
|---|
| ArgC MALDI |
 |
|---|
| LysN MALDI |
 |
|---|
| TryLysC MALDI |
 |
|---|
| Try LTQ |
 |
|---|
| ChTry LTQ |
 |
|---|
| ArgC LTQ |
 |
|---|
| LysN LTQ |
 |
|---|
| TryLysC LTQ |
 |
|---|
| Try MSlow |
 |
|---|
| ChTry MSlow |
 |
|---|
| ArgC MSlow |
 |
|---|
| LysN MSlow |
 |
|---|
| TryLysC MSlow |
 |
|---|
| Try MShigh |
 |
|---|
| ChTry MShigh |
 |
|---|
| ArgC MShigh |
 |
|---|
| LysN MShigh |
 |
|---|
| TryLysC MShigh |
 |
|---|
General Statistics
Number of major isoforms |
Number of additional isoforms |
Number of all proteins |
Number of amino acids |
Min. Seq. Length |
Max. Seq. Length |
Avg. Seq. Length |
Avg. Mol. Weight |
|---|---|---|---|---|---|---|---|
0 |
25224 |
44 |
1157 |
213.8 |
23.95 |
Amino acid frequency
Ala |
Cys |
Asp |
Glu |
Phe |
Gly |
His |
Ile |
Lys |
Leu |
|---|---|---|---|---|---|---|---|---|---|
7.862 ± 0.316 | 1.142 ± 0.12 |
6.343 ± 0.169 | 6.288 ± 0.223 |
4.135 ± 0.142 | 6.803 ± 0.262 |
2.026 ± 0.158 | 5.943 ± 0.139 |
7.021 ± 0.242 | 8.012 ± 0.252 |
Met |
Asn |
Gln |
Pro |
Arg |
Ser |
Thr |
Val |
Trp |
Tyr |
|---|---|---|---|---|---|---|---|---|---|
2.819 ± 0.149 | 5.209 ± 0.174 |
3.172 ± 0.162 | 3.631 ± 0.153 |
4.444 ± 0.187 | 6.72 ± 0.234 |
6.252 ± 0.316 | 6.898 ± 0.181 |
1.265 ± 0.145 | 4.016 ± 0.172 |
Most of the basic statistics you can see at this page can be downloaded from this CSV file
Proteome-pI is available under Creative Commons Attribution-NoDerivs license, for more details see here
| Reference: Kozlowski LP. Proteome-pI 2.0: Proteome Isoelectric Point Database Update. Nucleic Acids Res. 2021, doi: 10.1093/nar/gkab944 | Contact: Lukasz P. Kozlowski |
