Phlebia centrifuga
Taxonomy: cellular organisms; Eukaryota; Opisthokonta; Fungi; Dikarya; Basidiomycota; Agaricomycotina; Agaricomycetes; Agaricomycetes incertae sedis; Polyporales; Meruliaceae; Phlebia
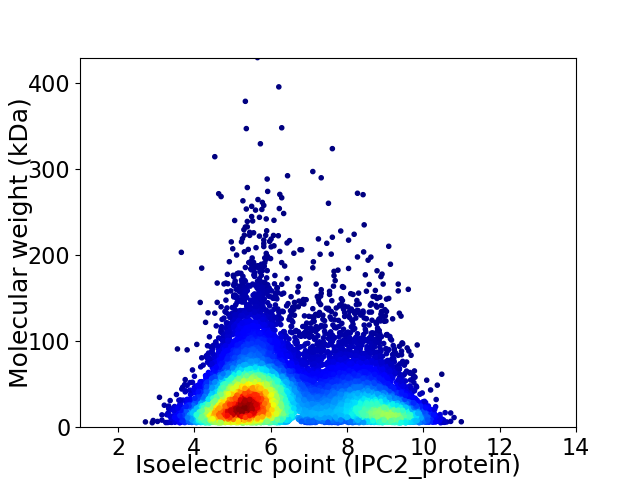
Average proteome isoelectric point is 6.41
Get precalculated fractions of proteins

Virtual 2D-PAGE plot for 13628 proteins (isoelectric point calculated using IPC2_protein)
Get csv file with sequences according to given criteria:
* You can choose from 21 different methods for calculating isoelectric point
Summary statistics related to proteome-wise predictions


Protein with the lowest isoelectric point:
>tr|A0A2R6S5A0|A0A2R6S5A0_9APHY Uncharacterized protein OS=Phlebia centrifuga OX=98765 GN=PHLCEN_2v674 PE=4 SV=1
MM1 pKa = 6.85STEE4 pKa = 4.14TTSLFSLARR13 pKa = 11.84NKK15 pKa = 10.16LQSVVGGGVKK25 pKa = 10.27DD26 pKa = 3.34SCSLHH31 pKa = 6.14RR32 pKa = 11.84WVLLKK37 pKa = 10.98NSIIRR42 pKa = 11.84SHH44 pKa = 7.15PPLAAHH50 pKa = 7.34DD51 pKa = 4.12ATDD54 pKa = 3.5EE55 pKa = 4.18ADD57 pKa = 3.35ADD59 pKa = 3.62SVYY62 pKa = 10.63RR63 pKa = 11.84HH64 pKa = 5.92EE65 pKa = 4.62EE66 pKa = 4.09EE67 pKa = 4.24EE68 pKa = 4.2SLEE71 pKa = 4.05EE72 pKa = 4.54DD73 pKa = 3.67EE74 pKa = 5.6QDD76 pKa = 2.92TFMFPDD82 pKa = 3.68PHH84 pKa = 7.52YY85 pKa = 10.13LLPDD89 pKa = 3.48EE90 pKa = 4.98TPAAGIDD97 pKa = 3.36EE98 pKa = 4.41RR99 pKa = 11.84QWLDD103 pKa = 3.16SLLEE107 pKa = 4.12GLEE110 pKa = 4.3DD111 pKa = 6.16DD112 pKa = 5.49EE113 pKa = 7.72DD114 pKa = 5.35DD115 pKa = 6.05DD116 pKa = 4.85YY117 pKa = 12.3SKK119 pKa = 11.74LDD121 pKa = 3.7GQLSALPTLATDD133 pKa = 4.88DD134 pKa = 3.76VAEE137 pKa = 4.61PLSPLYY143 pKa = 11.14SPMSSSDD150 pKa = 3.76DD151 pKa = 3.9LADD154 pKa = 3.35QSNYY158 pKa = 9.4FSYY161 pKa = 10.42PMPYY165 pKa = 9.65PPPHH169 pKa = 7.11PPLIPSWFEE178 pKa = 3.42LQAPSDD184 pKa = 4.03SALTSPVILCDD195 pKa = 3.64NPLPYY200 pKa = 10.49YY201 pKa = 10.78AVDD204 pKa = 4.12DD205 pKa = 5.09LEE207 pKa = 4.96DD208 pKa = 4.56LPVPDD213 pKa = 5.89AIEE216 pKa = 4.42DD217 pKa = 3.94TSDD220 pKa = 4.1DD221 pKa = 3.89EE222 pKa = 5.66SDD224 pKa = 3.84APSTPSATSTSSLAPINSSSISTPPGRR251 pKa = 11.84TRR253 pKa = 11.84FLSDD257 pKa = 3.05PQVYY261 pKa = 10.34VDD263 pKa = 3.9TDD265 pKa = 3.51DD266 pKa = 3.36SHH268 pKa = 7.36FYY270 pKa = 10.54PFEE273 pKa = 5.14LDD275 pKa = 3.53PLPFPGPYY283 pKa = 9.43HH284 pKa = 6.95AGVV287 pKa = 3.25
MM1 pKa = 6.85STEE4 pKa = 4.14TTSLFSLARR13 pKa = 11.84NKK15 pKa = 10.16LQSVVGGGVKK25 pKa = 10.27DD26 pKa = 3.34SCSLHH31 pKa = 6.14RR32 pKa = 11.84WVLLKK37 pKa = 10.98NSIIRR42 pKa = 11.84SHH44 pKa = 7.15PPLAAHH50 pKa = 7.34DD51 pKa = 4.12ATDD54 pKa = 3.5EE55 pKa = 4.18ADD57 pKa = 3.35ADD59 pKa = 3.62SVYY62 pKa = 10.63RR63 pKa = 11.84HH64 pKa = 5.92EE65 pKa = 4.62EE66 pKa = 4.09EE67 pKa = 4.24EE68 pKa = 4.2SLEE71 pKa = 4.05EE72 pKa = 4.54DD73 pKa = 3.67EE74 pKa = 5.6QDD76 pKa = 2.92TFMFPDD82 pKa = 3.68PHH84 pKa = 7.52YY85 pKa = 10.13LLPDD89 pKa = 3.48EE90 pKa = 4.98TPAAGIDD97 pKa = 3.36EE98 pKa = 4.41RR99 pKa = 11.84QWLDD103 pKa = 3.16SLLEE107 pKa = 4.12GLEE110 pKa = 4.3DD111 pKa = 6.16DD112 pKa = 5.49EE113 pKa = 7.72DD114 pKa = 5.35DD115 pKa = 6.05DD116 pKa = 4.85YY117 pKa = 12.3SKK119 pKa = 11.74LDD121 pKa = 3.7GQLSALPTLATDD133 pKa = 4.88DD134 pKa = 3.76VAEE137 pKa = 4.61PLSPLYY143 pKa = 11.14SPMSSSDD150 pKa = 3.76DD151 pKa = 3.9LADD154 pKa = 3.35QSNYY158 pKa = 9.4FSYY161 pKa = 10.42PMPYY165 pKa = 9.65PPPHH169 pKa = 7.11PPLIPSWFEE178 pKa = 3.42LQAPSDD184 pKa = 4.03SALTSPVILCDD195 pKa = 3.64NPLPYY200 pKa = 10.49YY201 pKa = 10.78AVDD204 pKa = 4.12DD205 pKa = 5.09LEE207 pKa = 4.96DD208 pKa = 4.56LPVPDD213 pKa = 5.89AIEE216 pKa = 4.42DD217 pKa = 3.94TSDD220 pKa = 4.1DD221 pKa = 3.89EE222 pKa = 5.66SDD224 pKa = 3.84APSTPSATSTSSLAPINSSSISTPPGRR251 pKa = 11.84TRR253 pKa = 11.84FLSDD257 pKa = 3.05PQVYY261 pKa = 10.34VDD263 pKa = 3.9TDD265 pKa = 3.51DD266 pKa = 3.36SHH268 pKa = 7.36FYY270 pKa = 10.54PFEE273 pKa = 5.14LDD275 pKa = 3.53PLPFPGPYY283 pKa = 9.43HH284 pKa = 6.95AGVV287 pKa = 3.25
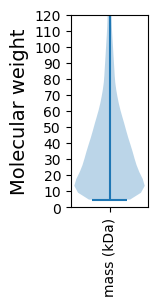
Molecular weight: 31.49 kDa
Isoelectric point according different methods:
Protein with the highest isoelectric point:
>tr|A0A2R6NYK5|A0A2R6NYK5_9APHY Uncharacterized protein OS=Phlebia centrifuga OX=98765 GN=PHLCEN_2v6923 PE=4 SV=1
MM1 pKa = 7.49AVIAKK6 pKa = 9.61IALAATGLARR16 pKa = 11.84SSKK19 pKa = 9.99PGRR22 pKa = 11.84ILNRR26 pKa = 11.84VVNQIARR33 pKa = 11.84MGVLVRR39 pKa = 11.84VLTWPKK45 pKa = 9.43YY46 pKa = 8.21PRR48 pKa = 11.84SGRR51 pKa = 11.84PLSRR55 pKa = 11.84LKK57 pKa = 10.93AA58 pKa = 3.68
MM1 pKa = 7.49AVIAKK6 pKa = 9.61IALAATGLARR16 pKa = 11.84SSKK19 pKa = 9.99PGRR22 pKa = 11.84ILNRR26 pKa = 11.84VVNQIARR33 pKa = 11.84MGVLVRR39 pKa = 11.84VLTWPKK45 pKa = 9.43YY46 pKa = 8.21PRR48 pKa = 11.84SGRR51 pKa = 11.84PLSRR55 pKa = 11.84LKK57 pKa = 10.93AA58 pKa = 3.68
Molecular weight: 6.32 kDa
Isoelectric point according different methods:
Peptides (in silico digests for buttom-up proteomics)
Below you can find in silico digests of the whole proteome with Trypsin, Chymotrypsin, Trypsin+LysC, LysN, ArgC proteases suitable for different mass spec machines.| Try ESI |
 |
|---|
| ChTry ESI |
 |
|---|
| ArgC ESI |
 |
|---|
| LysN ESI |
 |
|---|
| TryLysC ESI |
 |
|---|
| Try MALDI |
 |
|---|
| ChTry MALDI |
 |
|---|
| ArgC MALDI |
 |
|---|
| LysN MALDI |
 |
|---|
| TryLysC MALDI |
 |
|---|
| Try LTQ |
 |
|---|
| ChTry LTQ |
 |
|---|
| ArgC LTQ |
 |
|---|
| LysN LTQ |
 |
|---|
| TryLysC LTQ |
 |
|---|
| Try MSlow |
 |
|---|
| ChTry MSlow |
 |
|---|
| ArgC MSlow |
 |
|---|
| LysN MSlow |
 |
|---|
| TryLysC MSlow |
 |
|---|
| Try MShigh |
 |
|---|
| ChTry MShigh |
 |
|---|
| ArgC MShigh |
 |
|---|
| LysN MShigh |
 |
|---|
| TryLysC MShigh |
 |
|---|
General Statistics
Number of major isoforms |
Number of additional isoforms |
Number of all proteins |
Number of amino acids |
Min. Seq. Length |
Max. Seq. Length |
Avg. Seq. Length |
Avg. Mol. Weight |
|---|---|---|---|---|---|---|---|
0 |
5081813 |
49 |
3910 |
372.9 |
41.24 |
Amino acid frequency
Ala |
Cys |
Asp |
Glu |
Phe |
Gly |
His |
Ile |
Lys |
Leu |
|---|---|---|---|---|---|---|---|---|---|
8.38 ± 0.02 | 1.163 ± 0.008 |
5.789 ± 0.014 | 6.184 ± 0.022 |
3.598 ± 0.014 | 6.389 ± 0.02 |
2.532 ± 0.011 | 4.857 ± 0.015 |
4.612 ± 0.02 | 9.113 ± 0.023 |
Met |
Asn |
Gln |
Pro |
Arg |
Ser |
Thr |
Val |
Trp |
Tyr |
|---|---|---|---|---|---|---|---|---|---|
2.143 ± 0.009 | 3.421 ± 0.012 |
6.565 ± 0.024 | 3.788 ± 0.014 |
6.209 ± 0.018 | 8.851 ± 0.029 |
6.044 ± 0.013 | 6.359 ± 0.018 |
1.403 ± 0.007 | 2.6 ± 0.011 |
Most of the basic statistics you can see at this page can be downloaded from this CSV file
Proteome-pI is available under Creative Commons Attribution-NoDerivs license, for more details see here
| Reference: Kozlowski LP. Proteome-pI 2.0: Proteome Isoelectric Point Database Update. Nucleic Acids Res. 2021, doi: 10.1093/nar/gkab944 | Contact: Lukasz P. Kozlowski |
