Rhizobium sp. YS-1r
Taxonomy: cellular organisms; Bacteria; Proteobacteria; Alphaproteobacteria; Hyphomicrobiales; Rhizobiaceae; Rhizobium/Agrobacterium group; Rhizobium; unclassified Rhizobium
Average proteome isoelectric point is 6.44
Get precalculated fractions of proteins

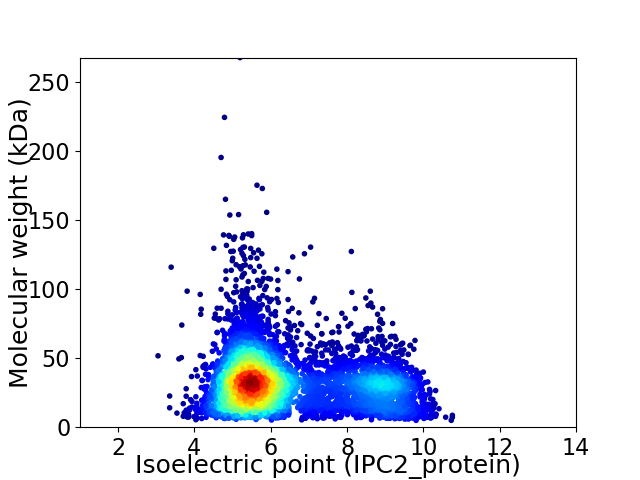
Virtual 2D-PAGE plot for 5595 proteins (isoelectric point calculated using IPC2_protein)
Get csv file with sequences according to given criteria:
* You can choose from 21 different methods for calculating isoelectric point
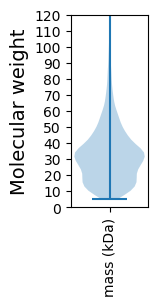
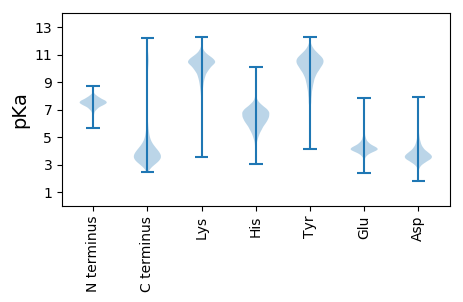
Summary statistics related to proteome-wise predictions


Protein with the lowest isoelectric point:
>tr|A0A095XRR0|A0A095XRR0_9RHIZ ABC transporter permease OS=Rhizobium sp. YS-1r OX=1532558 GN=JL39_02075 PE=3 SV=1
MM1 pKa = 7.73PNYY4 pKa = 9.84FVFGISLACYY14 pKa = 10.29LMAGTAGRR22 pKa = 11.84AADD25 pKa = 4.03VTPLLAQDD33 pKa = 4.0PNMVEE38 pKa = 4.76AQDD41 pKa = 3.18GWTFTFAPYY50 pKa = 10.16FWGTSISGDD59 pKa = 3.25TAQFSLPSVHH69 pKa = 6.9IDD71 pKa = 3.29ADD73 pKa = 3.76FGDD76 pKa = 4.62ILDD79 pKa = 4.77HH80 pKa = 7.51LDD82 pKa = 3.59FAAMAAGEE90 pKa = 3.95ARR92 pKa = 11.84YY93 pKa = 10.33DD94 pKa = 3.54RR95 pKa = 11.84FSIIGDD101 pKa = 3.27IEE103 pKa = 4.18YY104 pKa = 10.99AKK106 pKa = 10.69LSVGASTPLGILASDD121 pKa = 3.87VEE123 pKa = 4.83VATEE127 pKa = 4.05MFTGLVGAGYY137 pKa = 10.37SVLADD142 pKa = 3.19SSGYY146 pKa = 10.42LDD148 pKa = 3.25IVAGIKK154 pKa = 9.47VWSVDD159 pKa = 3.32TTISFSGGLLDD170 pKa = 4.11GVEE173 pKa = 4.56RR174 pKa = 11.84SDD176 pKa = 3.51SATWVDD182 pKa = 3.61GLAGIRR188 pKa = 11.84GRR190 pKa = 11.84YY191 pKa = 9.4SITPEE196 pKa = 3.79VYY198 pKa = 7.92ITGWGLVGGGGADD211 pKa = 4.18LDD213 pKa = 3.89WDD215 pKa = 3.77VALALGYY222 pKa = 10.52NFNEE226 pKa = 4.24RR227 pKa = 11.84LSVIAGYY234 pKa = 9.84RR235 pKa = 11.84AAGVDD240 pKa = 3.66YY241 pKa = 11.02SDD243 pKa = 4.83DD244 pKa = 3.64GFVFDD249 pKa = 5.75VVQQGPILSLALRR262 pKa = 11.84FF263 pKa = 3.85
MM1 pKa = 7.73PNYY4 pKa = 9.84FVFGISLACYY14 pKa = 10.29LMAGTAGRR22 pKa = 11.84AADD25 pKa = 4.03VTPLLAQDD33 pKa = 4.0PNMVEE38 pKa = 4.76AQDD41 pKa = 3.18GWTFTFAPYY50 pKa = 10.16FWGTSISGDD59 pKa = 3.25TAQFSLPSVHH69 pKa = 6.9IDD71 pKa = 3.29ADD73 pKa = 3.76FGDD76 pKa = 4.62ILDD79 pKa = 4.77HH80 pKa = 7.51LDD82 pKa = 3.59FAAMAAGEE90 pKa = 3.95ARR92 pKa = 11.84YY93 pKa = 10.33DD94 pKa = 3.54RR95 pKa = 11.84FSIIGDD101 pKa = 3.27IEE103 pKa = 4.18YY104 pKa = 10.99AKK106 pKa = 10.69LSVGASTPLGILASDD121 pKa = 3.87VEE123 pKa = 4.83VATEE127 pKa = 4.05MFTGLVGAGYY137 pKa = 10.37SVLADD142 pKa = 3.19SSGYY146 pKa = 10.42LDD148 pKa = 3.25IVAGIKK154 pKa = 9.47VWSVDD159 pKa = 3.32TTISFSGGLLDD170 pKa = 4.11GVEE173 pKa = 4.56RR174 pKa = 11.84SDD176 pKa = 3.51SATWVDD182 pKa = 3.61GLAGIRR188 pKa = 11.84GRR190 pKa = 11.84YY191 pKa = 9.4SITPEE196 pKa = 3.79VYY198 pKa = 7.92ITGWGLVGGGGADD211 pKa = 4.18LDD213 pKa = 3.89WDD215 pKa = 3.77VALALGYY222 pKa = 10.52NFNEE226 pKa = 4.24RR227 pKa = 11.84LSVIAGYY234 pKa = 9.84RR235 pKa = 11.84AAGVDD240 pKa = 3.66YY241 pKa = 11.02SDD243 pKa = 4.83DD244 pKa = 3.64GFVFDD249 pKa = 5.75VVQQGPILSLALRR262 pKa = 11.84FF263 pKa = 3.85
Molecular weight: 27.82 kDa
Isoelectric point according different methods:
Protein with the highest isoelectric point:
>tr|A0A095WTA8|A0A095WTA8_9RHIZ ABC transporter permease OS=Rhizobium sp. YS-1r OX=1532558 GN=JL39_03900 PE=4 SV=1
MM1 pKa = 7.88PNLINEE7 pKa = 4.32IVTGIVQSAMKK18 pKa = 10.04EE19 pKa = 4.02LLKK22 pKa = 10.59KK23 pKa = 9.97SHH25 pKa = 5.91GRR27 pKa = 11.84TSTKK31 pKa = 9.61RR32 pKa = 11.84KK33 pKa = 9.39KK34 pKa = 10.12RR35 pKa = 11.84QTRR38 pKa = 11.84SATSGRR44 pKa = 11.84FVTKK48 pKa = 8.43TTARR52 pKa = 11.84TAKK55 pKa = 9.42PAKK58 pKa = 9.17KK59 pKa = 9.17QVSRR63 pKa = 11.84RR64 pKa = 11.84RR65 pKa = 11.84TAASRR70 pKa = 11.84SRR72 pKa = 11.84QRR74 pKa = 11.84NHH76 pKa = 5.71
MM1 pKa = 7.88PNLINEE7 pKa = 4.32IVTGIVQSAMKK18 pKa = 10.04EE19 pKa = 4.02LLKK22 pKa = 10.59KK23 pKa = 9.97SHH25 pKa = 5.91GRR27 pKa = 11.84TSTKK31 pKa = 9.61RR32 pKa = 11.84KK33 pKa = 9.39KK34 pKa = 10.12RR35 pKa = 11.84QTRR38 pKa = 11.84SATSGRR44 pKa = 11.84FVTKK48 pKa = 8.43TTARR52 pKa = 11.84TAKK55 pKa = 9.42PAKK58 pKa = 9.17KK59 pKa = 9.17QVSRR63 pKa = 11.84RR64 pKa = 11.84RR65 pKa = 11.84TAASRR70 pKa = 11.84SRR72 pKa = 11.84QRR74 pKa = 11.84NHH76 pKa = 5.71
Molecular weight: 8.62 kDa
Isoelectric point according different methods:
Peptides (in silico digests for buttom-up proteomics)
Below you can find in silico digests of the whole proteome with Trypsin, Chymotrypsin, Trypsin+LysC, LysN, ArgC proteases suitable for different mass spec machines.| Try ESI |
 |
|---|
| ChTry ESI |
 |
|---|
| ArgC ESI |
 |
|---|
| LysN ESI |
 |
|---|
| TryLysC ESI |
 |
|---|
| Try MALDI |
 |
|---|
| ChTry MALDI |
 |
|---|
| ArgC MALDI |
 |
|---|
| LysN MALDI |
 |
|---|
| TryLysC MALDI |
 |
|---|
| Try LTQ |
 |
|---|
| ChTry LTQ |
 |
|---|
| ArgC LTQ |
 |
|---|
| LysN LTQ |
 |
|---|
| TryLysC LTQ |
 |
|---|
| Try MSlow |
 |
|---|
| ChTry MSlow |
 |
|---|
| ArgC MSlow |
 |
|---|
| LysN MSlow |
 |
|---|
| TryLysC MSlow |
 |
|---|
| Try MShigh |
 |
|---|
| ChTry MShigh |
 |
|---|
| ArgC MShigh |
 |
|---|
| LysN MShigh |
 |
|---|
| TryLysC MShigh |
 |
|---|
General Statistics
Number of major isoforms |
Number of additional isoforms |
Number of all proteins |
Number of amino acids |
Min. Seq. Length |
Max. Seq. Length |
Avg. Seq. Length |
Avg. Mol. Weight |
|---|---|---|---|---|---|---|---|
0 |
1746909 |
41 |
2482 |
312.2 |
34.07 |
Amino acid frequency
Ala |
Cys |
Asp |
Glu |
Phe |
Gly |
His |
Ile |
Lys |
Leu |
|---|---|---|---|---|---|---|---|---|---|
11.619 ± 0.04 | 0.786 ± 0.01 |
5.594 ± 0.025 | 5.966 ± 0.029 |
4.046 ± 0.023 | 8.346 ± 0.031 |
2.016 ± 0.015 | 5.81 ± 0.023 |
3.725 ± 0.028 | 9.955 ± 0.04 |
Met |
Asn |
Gln |
Pro |
Arg |
Ser |
Thr |
Val |
Trp |
Tyr |
|---|---|---|---|---|---|---|---|---|---|
2.705 ± 0.015 | 2.815 ± 0.017 |
5.043 ± 0.024 | 2.975 ± 0.017 |
6.725 ± 0.032 | 5.608 ± 0.022 |
5.242 ± 0.021 | 7.344 ± 0.031 |
1.314 ± 0.014 | 2.365 ± 0.016 |
Most of the basic statistics you can see at this page can be downloaded from this CSV file
Proteome-pI is available under Creative Commons Attribution-NoDerivs license, for more details see here
| Reference: Kozlowski LP. Proteome-pI 2.0: Proteome Isoelectric Point Database Update. Nucleic Acids Res. 2021, doi: 10.1093/nar/gkab944 | Contact: Lukasz P. Kozlowski |
