Acidomyces richmondensis BFW
Taxonomy: cellular organisms; Eukaryota; Opisthokonta; Fungi; Dikarya; Ascomycota; saccharomyceta; Pezizomycotina; leotiomyceta; dothideomyceta; Dothideomycetes; Dothideomycetidae; Mycosphaerellales; Teratosphaeriaceae; Acidomyces; unclassified Acidomyces; Acidomyces sp. 'richmondensis'
Average proteome isoelectric point is 6.81
Get precalculated fractions of proteins

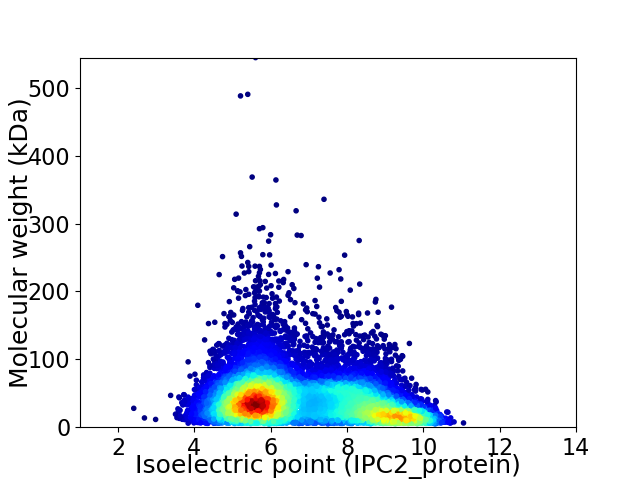
Virtual 2D-PAGE plot for 11098 proteins (isoelectric point calculated using IPC2_protein)
Get csv file with sequences according to given criteria:
* You can choose from 21 different methods for calculating isoelectric point
Summary statistics related to proteome-wise predictions


Protein with the lowest isoelectric point:
>tr|A0A150VB75|A0A150VB75_9PEZI AP complex subunit sigma OS=Acidomyces richmondensis BFW OX=766039 GN=M433DRAFT_2520 PE=3 SV=1
CC1 pKa = 7.48FLTLPDD7 pKa = 5.21DD8 pKa = 4.33PLSAEE13 pKa = 4.34GLSTPWTLGAPCSQAVTAQQAFAEE37 pKa = 4.44ASVFDD42 pKa = 4.07PTTNTVSVYY51 pKa = 10.37HH52 pKa = 6.4PLVINDD58 pKa = 3.22GMTPQVDD65 pKa = 3.84PVVPDD70 pKa = 3.74LPEE73 pKa = 4.06GAIVGLWFGFNGGVLQLLDD92 pKa = 3.82KK93 pKa = 10.82EE94 pKa = 4.72GRR96 pKa = 11.84DD97 pKa = 3.92TNEE100 pKa = 3.71SPTLQSIDD108 pKa = 4.25CVNGLPGVNGDD119 pKa = 3.71VFGQVSWCNTQPFWAAVNEE138 pKa = 4.29SFAAGKK144 pKa = 9.97IDD146 pKa = 3.84VPEE149 pKa = 5.34LGTDD153 pKa = 3.31HH154 pKa = 7.23NGRR157 pKa = 11.84PCPTSRR163 pKa = 11.84SFEE166 pKa = 4.1IVDD169 pKa = 3.91ACPSDD174 pKa = 4.08NVPTQYY180 pKa = 11.61LLLSDD185 pKa = 4.57GSTVQDD191 pKa = 3.25NASNRR196 pKa = 11.84EE197 pKa = 3.94KK198 pKa = 10.96FPDD201 pKa = 3.51AEE203 pKa = 4.51VINNASDD210 pKa = 3.29EE211 pKa = 4.25SLIANILDD219 pKa = 3.69PAIGCTPFLGEE230 pKa = 4.45NLDD233 pKa = 4.31DD234 pKa = 5.27PGTMFTSLALNEE246 pKa = 4.36LQAKK250 pKa = 9.27AHH252 pKa = 4.83QQAPIALVPLNDD264 pKa = 4.61PDD266 pKa = 4.18TLLTSDD272 pKa = 4.35GQVSPAKK279 pKa = 9.6TNAYY283 pKa = 9.63RR284 pKa = 11.84LGVNQPFLTASGPDD298 pKa = 3.61DD299 pKa = 4.26GSLDD303 pKa = 4.41FYY305 pKa = 10.64CSGMIEE311 pKa = 3.72IAPRR315 pKa = 11.84FFLDD319 pKa = 3.52NQDD322 pKa = 3.53TFTGMTSPATSVGNNLFTFMCNRR345 pKa = 11.84YY346 pKa = 9.68LEE348 pKa = 4.45SLTMLGCPKK357 pKa = 10.51NSSQPVACTLDD368 pKa = 3.66SNGAATSS375 pKa = 3.51
CC1 pKa = 7.48FLTLPDD7 pKa = 5.21DD8 pKa = 4.33PLSAEE13 pKa = 4.34GLSTPWTLGAPCSQAVTAQQAFAEE37 pKa = 4.44ASVFDD42 pKa = 4.07PTTNTVSVYY51 pKa = 10.37HH52 pKa = 6.4PLVINDD58 pKa = 3.22GMTPQVDD65 pKa = 3.84PVVPDD70 pKa = 3.74LPEE73 pKa = 4.06GAIVGLWFGFNGGVLQLLDD92 pKa = 3.82KK93 pKa = 10.82EE94 pKa = 4.72GRR96 pKa = 11.84DD97 pKa = 3.92TNEE100 pKa = 3.71SPTLQSIDD108 pKa = 4.25CVNGLPGVNGDD119 pKa = 3.71VFGQVSWCNTQPFWAAVNEE138 pKa = 4.29SFAAGKK144 pKa = 9.97IDD146 pKa = 3.84VPEE149 pKa = 5.34LGTDD153 pKa = 3.31HH154 pKa = 7.23NGRR157 pKa = 11.84PCPTSRR163 pKa = 11.84SFEE166 pKa = 4.1IVDD169 pKa = 3.91ACPSDD174 pKa = 4.08NVPTQYY180 pKa = 11.61LLLSDD185 pKa = 4.57GSTVQDD191 pKa = 3.25NASNRR196 pKa = 11.84EE197 pKa = 3.94KK198 pKa = 10.96FPDD201 pKa = 3.51AEE203 pKa = 4.51VINNASDD210 pKa = 3.29EE211 pKa = 4.25SLIANILDD219 pKa = 3.69PAIGCTPFLGEE230 pKa = 4.45NLDD233 pKa = 4.31DD234 pKa = 5.27PGTMFTSLALNEE246 pKa = 4.36LQAKK250 pKa = 9.27AHH252 pKa = 4.83QQAPIALVPLNDD264 pKa = 4.61PDD266 pKa = 4.18TLLTSDD272 pKa = 4.35GQVSPAKK279 pKa = 9.6TNAYY283 pKa = 9.63RR284 pKa = 11.84LGVNQPFLTASGPDD298 pKa = 3.61DD299 pKa = 4.26GSLDD303 pKa = 4.41FYY305 pKa = 10.64CSGMIEE311 pKa = 3.72IAPRR315 pKa = 11.84FFLDD319 pKa = 3.52NQDD322 pKa = 3.53TFTGMTSPATSVGNNLFTFMCNRR345 pKa = 11.84YY346 pKa = 9.68LEE348 pKa = 4.45SLTMLGCPKK357 pKa = 10.51NSSQPVACTLDD368 pKa = 3.66SNGAATSS375 pKa = 3.51
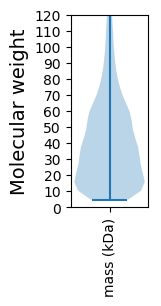
Molecular weight: 39.74 kDa
Isoelectric point according different methods:
Protein with the highest isoelectric point:
>tr|A0A150VDT9|A0A150VDT9_9PEZI DNA polymerase (Fragment) OS=Acidomyces richmondensis BFW OX=766039 GN=M433DRAFT_49008 PE=3 SV=1
MM1 pKa = 7.88PSHH4 pKa = 6.91KK5 pKa = 10.39SFRR8 pKa = 11.84TKK10 pKa = 10.45QKK12 pKa = 9.84LAKK15 pKa = 9.55AQKK18 pKa = 8.59QNRR21 pKa = 11.84PIPQWIRR28 pKa = 11.84LRR30 pKa = 11.84TGNTIRR36 pKa = 11.84YY37 pKa = 5.79NAKK40 pKa = 8.89RR41 pKa = 11.84RR42 pKa = 11.84HH43 pKa = 4.15WRR45 pKa = 11.84KK46 pKa = 7.38TRR48 pKa = 11.84IGII51 pKa = 4.0
MM1 pKa = 7.88PSHH4 pKa = 6.91KK5 pKa = 10.39SFRR8 pKa = 11.84TKK10 pKa = 10.45QKK12 pKa = 9.84LAKK15 pKa = 9.55AQKK18 pKa = 8.59QNRR21 pKa = 11.84PIPQWIRR28 pKa = 11.84LRR30 pKa = 11.84TGNTIRR36 pKa = 11.84YY37 pKa = 5.79NAKK40 pKa = 8.89RR41 pKa = 11.84RR42 pKa = 11.84HH43 pKa = 4.15WRR45 pKa = 11.84KK46 pKa = 7.38TRR48 pKa = 11.84IGII51 pKa = 4.0
Molecular weight: 6.25 kDa
Isoelectric point according different methods:
Peptides (in silico digests for buttom-up proteomics)
Below you can find in silico digests of the whole proteome with Trypsin, Chymotrypsin, Trypsin+LysC, LysN, ArgC proteases suitable for different mass spec machines.| Try ESI |
 |
|---|
| ChTry ESI |
 |
|---|
| ArgC ESI |
 |
|---|
| LysN ESI |
 |
|---|
| TryLysC ESI |
 |
|---|
| Try MALDI |
 |
|---|
| ChTry MALDI |
 |
|---|
| ArgC MALDI |
 |
|---|
| LysN MALDI |
 |
|---|
| TryLysC MALDI |
 |
|---|
| Try LTQ |
 |
|---|
| ChTry LTQ |
 |
|---|
| ArgC LTQ |
 |
|---|
| LysN LTQ |
 |
|---|
| TryLysC LTQ |
 |
|---|
| Try MSlow |
 |
|---|
| ChTry MSlow |
 |
|---|
| ArgC MSlow |
 |
|---|
| LysN MSlow |
 |
|---|
| TryLysC MSlow |
 |
|---|
| Try MShigh |
 |
|---|
| ChTry MShigh |
 |
|---|
| ArgC MShigh |
 |
|---|
| LysN MShigh |
 |
|---|
| TryLysC MShigh |
 |
|---|
General Statistics
Number of major isoforms |
Number of additional isoforms |
Number of all proteins |
Number of amino acids |
Min. Seq. Length |
Max. Seq. Length |
Avg. Seq. Length |
Avg. Mol. Weight |
|---|---|---|---|---|---|---|---|
0 |
4519851 |
49 |
4874 |
407.3 |
45.19 |
Amino acid frequency
Ala |
Cys |
Asp |
Glu |
Phe |
Gly |
His |
Ile |
Lys |
Leu |
|---|---|---|---|---|---|---|---|---|---|
8.63 ± 0.022 | 1.359 ± 0.01 |
5.463 ± 0.018 | 6.206 ± 0.022 |
3.679 ± 0.015 | 6.975 ± 0.024 |
2.509 ± 0.01 | 5.047 ± 0.017 |
4.797 ± 0.02 | 8.874 ± 0.029 |
Met |
Asn |
Gln |
Pro |
Arg |
Ser |
Thr |
Val |
Trp |
Tyr |
|---|---|---|---|---|---|---|---|---|---|
2.303 ± 0.009 | 3.702 ± 0.012 |
5.824 ± 0.025 | 4.106 ± 0.019 |
6.436 ± 0.022 | 7.958 ± 0.029 |
5.787 ± 0.016 | 6.04 ± 0.016 |
1.489 ± 0.009 | 2.815 ± 0.013 |
Most of the basic statistics you can see at this page can be downloaded from this CSV file
Proteome-pI is available under Creative Commons Attribution-NoDerivs license, for more details see here
| Reference: Kozlowski LP. Proteome-pI 2.0: Proteome Isoelectric Point Database Update. Nucleic Acids Res. 2021, doi: 10.1093/nar/gkab944 | Contact: Lukasz P. Kozlowski |
