Desulfonauticus submarinus
Taxonomy: cellular organisms; Bacteria; Proteobacteria; delta/epsilon subdivisions; Deltaproteobacteria; Desulfovibrionales; Desulfohalobiaceae; Desulfonauticus
Average proteome isoelectric point is 7.51
Get precalculated fractions of proteins

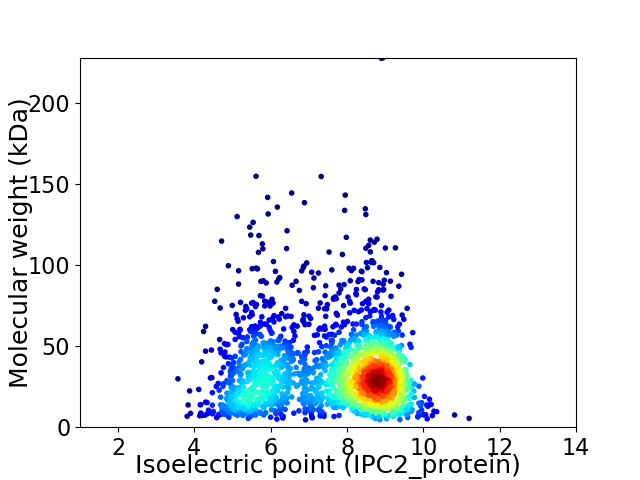
Virtual 2D-PAGE plot for 2044 proteins (isoelectric point calculated using IPC2_protein)
Get csv file with sequences according to given criteria:
* You can choose from 21 different methods for calculating isoelectric point
Summary statistics related to proteome-wise predictions


Protein with the lowest isoelectric point:
>tr|A0A1H0EYP9|A0A1H0EYP9_9DELT Acetoin utilization protein AcuB OS=Desulfonauticus submarinus OX=206665 GN=SAMN04488516_1103 PE=4 SV=1
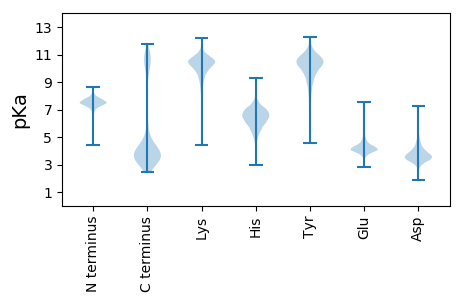
MM1 pKa = 7.54KK2 pKa = 10.2KK3 pKa = 10.41YY4 pKa = 10.49FFLFMFLTIFFSFLINFAYY23 pKa = 10.06AADD26 pKa = 4.5YY27 pKa = 10.6ILQSGQTSDD36 pKa = 3.16QTNAKK41 pKa = 9.95DD42 pKa = 3.19ITGAPNFLNDD52 pKa = 3.61NDD54 pKa = 4.19SFTIEE59 pKa = 4.01SGASIGLDD67 pKa = 2.9TGIYY71 pKa = 10.88DD72 pKa = 3.89MAIAGNNTNTITIRR86 pKa = 11.84TGGNVIFSYY95 pKa = 11.45NMLGAATLYY104 pKa = 10.78GIYY107 pKa = 9.89VQNNNTINNAGNISSISNSAASTEE131 pKa = 4.04IYY133 pKa = 10.24GIHH136 pKa = 6.56ASDD139 pKa = 4.22YY140 pKa = 9.17NTIINSGDD148 pKa = 3.18ISIMTDD154 pKa = 3.07TNIGNGEE161 pKa = 4.15VYY163 pKa = 10.69GIYY166 pKa = 10.54ANNYY170 pKa = 6.09NTISNSDD177 pKa = 4.27SISVIANSNDD187 pKa = 2.63NGYY190 pKa = 11.23AYY192 pKa = 10.2GIYY195 pKa = 10.72ANDD198 pKa = 3.83SNNISNSGSIDD209 pKa = 3.23ANANNNHH216 pKa = 5.93NEE218 pKa = 3.12GRR220 pKa = 11.84AYY222 pKa = 10.32GISANASNIITNSGSINATANDD244 pKa = 3.71NDD246 pKa = 4.08DD247 pKa = 3.69GEE249 pKa = 5.68AYY251 pKa = 10.32GIYY254 pKa = 10.11AYY256 pKa = 10.28DD257 pKa = 3.72YY258 pKa = 11.38NNISNSGTIYY268 pKa = 10.87VIANNNNDD276 pKa = 3.1GTEE279 pKa = 3.69AA280 pKa = 3.7
MM1 pKa = 7.54KK2 pKa = 10.2KK3 pKa = 10.41YY4 pKa = 10.49FFLFMFLTIFFSFLINFAYY23 pKa = 10.06AADD26 pKa = 4.5YY27 pKa = 10.6ILQSGQTSDD36 pKa = 3.16QTNAKK41 pKa = 9.95DD42 pKa = 3.19ITGAPNFLNDD52 pKa = 3.61NDD54 pKa = 4.19SFTIEE59 pKa = 4.01SGASIGLDD67 pKa = 2.9TGIYY71 pKa = 10.88DD72 pKa = 3.89MAIAGNNTNTITIRR86 pKa = 11.84TGGNVIFSYY95 pKa = 11.45NMLGAATLYY104 pKa = 10.78GIYY107 pKa = 9.89VQNNNTINNAGNISSISNSAASTEE131 pKa = 4.04IYY133 pKa = 10.24GIHH136 pKa = 6.56ASDD139 pKa = 4.22YY140 pKa = 9.17NTIINSGDD148 pKa = 3.18ISIMTDD154 pKa = 3.07TNIGNGEE161 pKa = 4.15VYY163 pKa = 10.69GIYY166 pKa = 10.54ANNYY170 pKa = 6.09NTISNSDD177 pKa = 4.27SISVIANSNDD187 pKa = 2.63NGYY190 pKa = 11.23AYY192 pKa = 10.2GIYY195 pKa = 10.72ANDD198 pKa = 3.83SNNISNSGSIDD209 pKa = 3.23ANANNNHH216 pKa = 5.93NEE218 pKa = 3.12GRR220 pKa = 11.84AYY222 pKa = 10.32GISANASNIITNSGSINATANDD244 pKa = 3.71NDD246 pKa = 4.08DD247 pKa = 3.69GEE249 pKa = 5.68AYY251 pKa = 10.32GIYY254 pKa = 10.11AYY256 pKa = 10.28DD257 pKa = 3.72YY258 pKa = 11.38NNISNSGTIYY268 pKa = 10.87VIANNNNDD276 pKa = 3.1GTEE279 pKa = 3.69AA280 pKa = 3.7
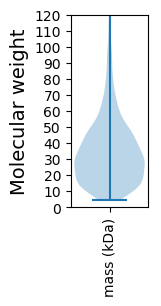
Molecular weight: 29.84 kDa
Isoelectric point according different methods:
Protein with the highest isoelectric point:
>tr|A0A1H0F8Q4|A0A1H0F8Q4_9DELT Cytochrome d ubiquinol oxidase subunit II OS=Desulfonauticus submarinus OX=206665 GN=SAMN04488516_11137 PE=3 SV=1
MM1 pKa = 7.35KK2 pKa = 9.43RR3 pKa = 11.84TYY5 pKa = 10.17QPSKK9 pKa = 8.88IKK11 pKa = 10.27RR12 pKa = 11.84KK13 pKa = 9.0RR14 pKa = 11.84RR15 pKa = 11.84HH16 pKa = 5.09GFLVRR21 pKa = 11.84MRR23 pKa = 11.84TRR25 pKa = 11.84GGKK28 pKa = 7.75QVIRR32 pKa = 11.84RR33 pKa = 11.84RR34 pKa = 11.84RR35 pKa = 11.84AKK37 pKa = 9.59GRR39 pKa = 11.84KK40 pKa = 8.66RR41 pKa = 11.84LAVV44 pKa = 3.41
MM1 pKa = 7.35KK2 pKa = 9.43RR3 pKa = 11.84TYY5 pKa = 10.17QPSKK9 pKa = 8.88IKK11 pKa = 10.27RR12 pKa = 11.84KK13 pKa = 9.0RR14 pKa = 11.84RR15 pKa = 11.84HH16 pKa = 5.09GFLVRR21 pKa = 11.84MRR23 pKa = 11.84TRR25 pKa = 11.84GGKK28 pKa = 7.75QVIRR32 pKa = 11.84RR33 pKa = 11.84RR34 pKa = 11.84RR35 pKa = 11.84AKK37 pKa = 9.59GRR39 pKa = 11.84KK40 pKa = 8.66RR41 pKa = 11.84LAVV44 pKa = 3.41
Molecular weight: 5.42 kDa
Isoelectric point according different methods:
Peptides (in silico digests for buttom-up proteomics)
Below you can find in silico digests of the whole proteome with Trypsin, Chymotrypsin, Trypsin+LysC, LysN, ArgC proteases suitable for different mass spec machines.| Try ESI |
 |
|---|
| ChTry ESI |
 |
|---|
| ArgC ESI |
 |
|---|
| LysN ESI |
 |
|---|
| TryLysC ESI |
 |
|---|
| Try MALDI |
 |
|---|
| ChTry MALDI |
 |
|---|
| ArgC MALDI |
 |
|---|
| LysN MALDI |
 |
|---|
| TryLysC MALDI |
 |
|---|
| Try LTQ |
 |
|---|
| ChTry LTQ |
 |
|---|
| ArgC LTQ |
 |
|---|
| LysN LTQ |
 |
|---|
| TryLysC LTQ |
 |
|---|
| Try MSlow |
 |
|---|
| ChTry MSlow |
 |
|---|
| ArgC MSlow |
 |
|---|
| LysN MSlow |
 |
|---|
| TryLysC MSlow |
 |
|---|
| Try MShigh |
 |
|---|
| ChTry MShigh |
 |
|---|
| ArgC MShigh |
 |
|---|
| LysN MShigh |
 |
|---|
| TryLysC MShigh |
 |
|---|
General Statistics
Number of major isoforms |
Number of additional isoforms |
Number of all proteins |
Number of amino acids |
Min. Seq. Length |
Max. Seq. Length |
Avg. Seq. Length |
Avg. Mol. Weight |
|---|---|---|---|---|---|---|---|
0 |
651272 |
39 |
2021 |
318.6 |
36.13 |
Amino acid frequency
Ala |
Cys |
Asp |
Glu |
Phe |
Gly |
His |
Ile |
Lys |
Leu |
|---|---|---|---|---|---|---|---|---|---|
6.056 ± 0.054 | 1.28 ± 0.025 |
4.5 ± 0.035 | 6.842 ± 0.062 |
5.315 ± 0.05 | 6.29 ± 0.051 |
1.706 ± 0.021 | 8.612 ± 0.055 |
9.393 ± 0.063 | 11.282 ± 0.059 |
Met |
Asn |
Gln |
Pro |
Arg |
Ser |
Thr |
Val |
Trp |
Tyr |
|---|---|---|---|---|---|---|---|---|---|
1.893 ± 0.026 | 4.766 ± 0.041 |
3.983 ± 0.037 | 3.464 ± 0.032 |
3.82 ± 0.041 | 5.717 ± 0.042 |
4.382 ± 0.036 | 6.089 ± 0.056 |
1.086 ± 0.019 | 3.525 ± 0.031 |
Most of the basic statistics you can see at this page can be downloaded from this CSV file
Proteome-pI is available under Creative Commons Attribution-NoDerivs license, for more details see here
| Reference: Kozlowski LP. Proteome-pI 2.0: Proteome Isoelectric Point Database Update. Nucleic Acids Res. 2021, doi: 10.1093/nar/gkab944 | Contact: Lukasz P. Kozlowski |
