Janthinobacterium agaricidamnosum NBRC 102515 = DSM 9628
Taxonomy: cellular organisms; Bacteria; Proteobacteria; Betaproteobacteria; Burkholderiales; Oxalobacteraceae; Janthinobacterium; Janthinobacterium agaricidamnosum
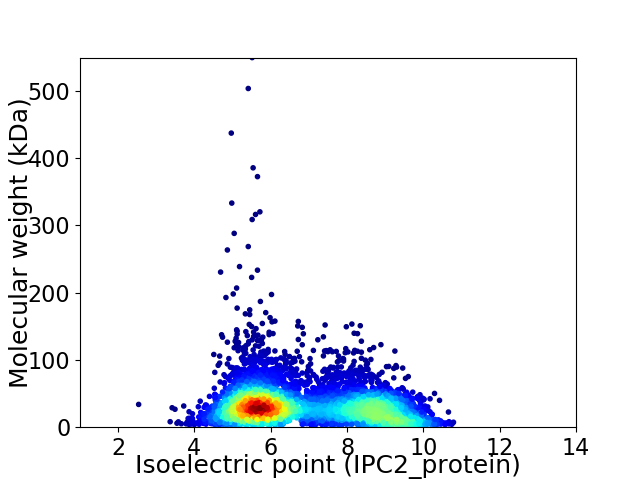
Average proteome isoelectric point is 6.89
Get precalculated fractions of proteins

Virtual 2D-PAGE plot for 5488 proteins (isoelectric point calculated using IPC2_protein)
Get csv file with sequences according to given criteria:
* You can choose from 21 different methods for calculating isoelectric point
Summary statistics related to proteome-wise predictions


Protein with the lowest isoelectric point:
>tr|W0V944|W0V944_9BURK CRISPR-associated endonuclease Cas1 OS=Janthinobacterium agaricidamnosum NBRC 102515 = DSM 9628 OX=1349767 GN=cas1 PE=3 SV=1
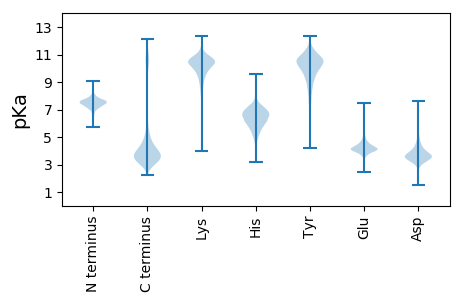
MM1 pKa = 6.86XXQAATAADD10 pKa = 3.61AQAAASAAQAAISLAALHH28 pKa = 6.78AAQADD33 pKa = 3.94DD34 pKa = 3.87AAAAAAAAFAAQAQANAQQAHH55 pKa = 6.95ADD57 pKa = 3.93DD58 pKa = 4.82ASAAAAQAAADD69 pKa = 3.85AAQVALAQANAIAAQTDD86 pKa = 3.39AHH88 pKa = 6.57ALGLISDD95 pKa = 4.67ADD97 pKa = 3.78ALAAAAAQAIADD109 pKa = 3.95QTDD112 pKa = 3.18AAALAQQAAAHH123 pKa = 6.35AAAAAAAQATADD135 pKa = 3.94LTDD138 pKa = 3.64AQALGLVADD147 pKa = 4.87AAHH150 pKa = 6.92AAAIDD155 pKa = 3.78ASNQADD161 pKa = 4.1LTDD164 pKa = 3.82AAALAQIASHH174 pKa = 7.05DD175 pKa = 3.76AAAALAAQQLADD187 pKa = 3.89LTDD190 pKa = 4.09ANHH193 pKa = 7.24LLTISTLAHH202 pKa = 6.52NSPQIVTGFQGGALADD218 pKa = 4.11GGDD221 pKa = 4.11VIDD224 pKa = 5.85LSALGHH230 pKa = 6.62LGSLSLAAGVNLHH243 pKa = 6.29TDD245 pKa = 4.16FGADD249 pKa = 3.0NFFVFDD255 pKa = 4.09DD256 pKa = 4.32TPISIHH262 pKa = 6.44DD263 pKa = 5.09AISAIAADD271 pKa = 3.97SSVLSGQGYY280 pKa = 9.7IVIHH284 pKa = 6.79DD285 pKa = 4.0AANNGAVTLYY295 pKa = 10.44HH296 pKa = 7.05SSDD299 pKa = 3.39LSSATGTEE307 pKa = 3.98TALVLLSGLTTTQHH321 pKa = 5.64LTQANFIVV329 pKa = 3.64
MM1 pKa = 6.86XXQAATAADD10 pKa = 3.61AQAAASAAQAAISLAALHH28 pKa = 6.78AAQADD33 pKa = 3.94DD34 pKa = 3.87AAAAAAAAFAAQAQANAQQAHH55 pKa = 6.95ADD57 pKa = 3.93DD58 pKa = 4.82ASAAAAQAAADD69 pKa = 3.85AAQVALAQANAIAAQTDD86 pKa = 3.39AHH88 pKa = 6.57ALGLISDD95 pKa = 4.67ADD97 pKa = 3.78ALAAAAAQAIADD109 pKa = 3.95QTDD112 pKa = 3.18AAALAQQAAAHH123 pKa = 6.35AAAAAAAQATADD135 pKa = 3.94LTDD138 pKa = 3.64AQALGLVADD147 pKa = 4.87AAHH150 pKa = 6.92AAAIDD155 pKa = 3.78ASNQADD161 pKa = 4.1LTDD164 pKa = 3.82AAALAQIASHH174 pKa = 7.05DD175 pKa = 3.76AAAALAAQQLADD187 pKa = 3.89LTDD190 pKa = 4.09ANHH193 pKa = 7.24LLTISTLAHH202 pKa = 6.52NSPQIVTGFQGGALADD218 pKa = 4.11GGDD221 pKa = 4.11VIDD224 pKa = 5.85LSALGHH230 pKa = 6.62LGSLSLAAGVNLHH243 pKa = 6.29TDD245 pKa = 4.16FGADD249 pKa = 3.0NFFVFDD255 pKa = 4.09DD256 pKa = 4.32TPISIHH262 pKa = 6.44DD263 pKa = 5.09AISAIAADD271 pKa = 3.97SSVLSGQGYY280 pKa = 9.7IVIHH284 pKa = 6.79DD285 pKa = 4.0AANNGAVTLYY295 pKa = 10.44HH296 pKa = 7.05SSDD299 pKa = 3.39LSSATGTEE307 pKa = 3.98TALVLLSGLTTTQHH321 pKa = 5.64LTQANFIVV329 pKa = 3.64
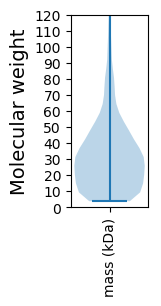
Molecular weight: 31.49 kDa
Isoelectric point according different methods:
Protein with the highest isoelectric point:
>tr|W0VDK5|W0VDK5_9BURK NUDIX domain protein OS=Janthinobacterium agaricidamnosum NBRC 102515 = DSM 9628 OX=1349767 GN=GJA_4844 PE=4 SV=1
MM1 pKa = 7.13TRR3 pKa = 11.84QLARR7 pKa = 11.84RR8 pKa = 11.84LAKK11 pKa = 9.85VWPRR15 pKa = 11.84QAWLQPMQVLISSVRR30 pKa = 11.84PLAALLTNSGSARR43 pKa = 11.84NGRR46 pKa = 11.84AIDD49 pKa = 3.62TRR51 pKa = 11.84SASPRR56 pKa = 11.84SMMM59 pKa = 4.79
MM1 pKa = 7.13TRR3 pKa = 11.84QLARR7 pKa = 11.84RR8 pKa = 11.84LAKK11 pKa = 9.85VWPRR15 pKa = 11.84QAWLQPMQVLISSVRR30 pKa = 11.84PLAALLTNSGSARR43 pKa = 11.84NGRR46 pKa = 11.84AIDD49 pKa = 3.62TRR51 pKa = 11.84SASPRR56 pKa = 11.84SMMM59 pKa = 4.79
Molecular weight: 6.6 kDa
Isoelectric point according different methods:
Peptides (in silico digests for buttom-up proteomics)
Below you can find in silico digests of the whole proteome with Trypsin, Chymotrypsin, Trypsin+LysC, LysN, ArgC proteases suitable for different mass spec machines.| Try ESI |
 |
|---|
| ChTry ESI |
 |
|---|
| ArgC ESI |
 |
|---|
| LysN ESI |
 |
|---|
| TryLysC ESI |
 |
|---|
| Try MALDI |
 |
|---|
| ChTry MALDI |
 |
|---|
| ArgC MALDI |
 |
|---|
| LysN MALDI |
 |
|---|
| TryLysC MALDI |
 |
|---|
| Try LTQ |
 |
|---|
| ChTry LTQ |
 |
|---|
| ArgC LTQ |
 |
|---|
| LysN LTQ |
 |
|---|
| TryLysC LTQ |
 |
|---|
| Try MSlow |
 |
|---|
| ChTry MSlow |
 |
|---|
| ArgC MSlow |
 |
|---|
| LysN MSlow |
 |
|---|
| TryLysC MSlow |
 |
|---|
| Try MShigh |
 |
|---|
| ChTry MShigh |
 |
|---|
| ArgC MShigh |
 |
|---|
| LysN MShigh |
 |
|---|
| TryLysC MShigh |
 |
|---|
General Statistics
Number of major isoforms |
Number of additional isoforms |
Number of all proteins |
Number of amino acids |
Min. Seq. Length |
Max. Seq. Length |
Avg. Seq. Length |
Avg. Mol. Weight |
|---|---|---|---|---|---|---|---|
0 |
1754291 |
37 |
5090 |
319.7 |
34.71 |
Amino acid frequency
Ala |
Cys |
Asp |
Glu |
Phe |
Gly |
His |
Ile |
Lys |
Leu |
|---|---|---|---|---|---|---|---|---|---|
12.432 ± 0.057 | 0.879 ± 0.012 |
5.429 ± 0.023 | 4.77 ± 0.03 |
3.579 ± 0.024 | 8.142 ± 0.04 |
2.265 ± 0.019 | 4.975 ± 0.025 |
3.68 ± 0.029 | 10.897 ± 0.044 |
Met |
Asn |
Gln |
Pro |
Arg |
Ser |
Thr |
Val |
Trp |
Tyr |
|---|---|---|---|---|---|---|---|---|---|
2.451 ± 0.019 | 3.21 ± 0.03 |
4.913 ± 0.029 | 4.369 ± 0.025 |
6.169 ± 0.034 | 6.01 ± 0.033 |
4.988 ± 0.032 | 6.952 ± 0.029 |
1.309 ± 0.012 | 2.566 ± 0.02 |
Most of the basic statistics you can see at this page can be downloaded from this CSV file
Proteome-pI is available under Creative Commons Attribution-NoDerivs license, for more details see here
| Reference: Kozlowski LP. Proteome-pI 2.0: Proteome Isoelectric Point Database Update. Nucleic Acids Res. 2021, doi: 10.1093/nar/gkab944 | Contact: Lukasz P. Kozlowski |
