Thioclava atlantica
Taxonomy: cellular organisms; Bacteria; Proteobacteria; Alphaproteobacteria; Rhodobacterales; Rhodobacteraceae; Thioclava
Average proteome isoelectric point is 6.33
Get precalculated fractions of proteins

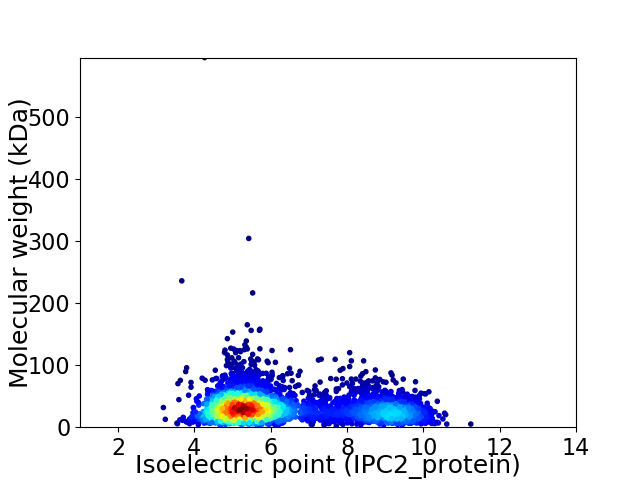
Virtual 2D-PAGE plot for 3767 proteins (isoelectric point calculated using IPC2_protein)
Get csv file with sequences according to given criteria:
* You can choose from 21 different methods for calculating isoelectric point
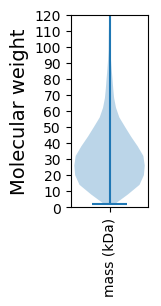
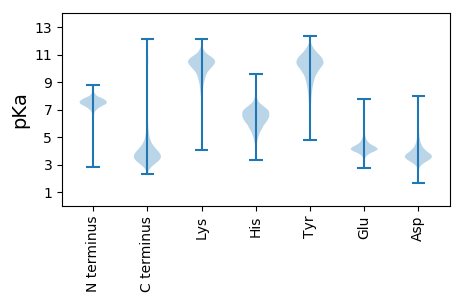
Summary statistics related to proteome-wise predictions


Protein with the lowest isoelectric point:
>tr|A0A085TTQ9|A0A085TTQ9_9RHOB Integrase family protein OS=Thioclava atlantica OX=1317124 GN=DW2_13935 PE=4 SV=1
MM1 pKa = 7.44KK2 pKa = 10.19KK3 pKa = 10.41VLFATTALVLSAGVAAAEE21 pKa = 4.25VSVGGDD27 pKa = 2.67GRR29 pKa = 11.84MGVMYY34 pKa = 10.63NGSDD38 pKa = 2.94WNFNSRR44 pKa = 11.84IRR46 pKa = 11.84AKK48 pKa = 9.97FTMSGQTDD56 pKa = 3.39GGLEE60 pKa = 4.0FGGSVRR66 pKa = 11.84ADD68 pKa = 3.11QATNATSGTSASVYY82 pKa = 10.11ISGAFGKK89 pKa = 10.65VSMGDD94 pKa = 3.23VVGASEE100 pKa = 5.28ALFGDD105 pKa = 4.43LAEE108 pKa = 4.58VGYY111 pKa = 9.56TDD113 pKa = 5.8LDD115 pKa = 3.95GAGLGNISGLSVGASRR131 pKa = 11.84NNMGANEE138 pKa = 4.0IPYY141 pKa = 9.04LTGDD145 pKa = 3.12NGGSVVGSTANTGPNLLYY163 pKa = 10.3TGTFGAFSVAASASDD178 pKa = 3.36GKK180 pKa = 10.9AVSTSDD186 pKa = 3.29NQEE189 pKa = 3.72YY190 pKa = 10.9ALAAAYY196 pKa = 9.42TMGDD200 pKa = 3.51YY201 pKa = 10.73TIGAGYY207 pKa = 10.04EE208 pKa = 4.11IVDD211 pKa = 3.72VTTGQNWKK219 pKa = 9.78QGEE222 pKa = 4.39IVGTATFGNTAVKK235 pKa = 10.07AYY237 pKa = 10.07YY238 pKa = 10.73ADD240 pKa = 3.66GSGGNNLDD248 pKa = 3.14KK249 pKa = 10.88AYY251 pKa = 10.2GIGVSSVFGATTVNGYY267 pKa = 9.99VNYY270 pKa = 11.03AEE272 pKa = 4.78ATDD275 pKa = 4.09GTNGTAYY282 pKa = 10.44GIGAAYY288 pKa = 10.27DD289 pKa = 3.73LGGGASVVGGVADD302 pKa = 3.87SDD304 pKa = 3.68IAGTDD309 pKa = 3.35TQADD313 pKa = 3.89LGIKK317 pKa = 10.64FSFF320 pKa = 3.88
MM1 pKa = 7.44KK2 pKa = 10.19KK3 pKa = 10.41VLFATTALVLSAGVAAAEE21 pKa = 4.25VSVGGDD27 pKa = 2.67GRR29 pKa = 11.84MGVMYY34 pKa = 10.63NGSDD38 pKa = 2.94WNFNSRR44 pKa = 11.84IRR46 pKa = 11.84AKK48 pKa = 9.97FTMSGQTDD56 pKa = 3.39GGLEE60 pKa = 4.0FGGSVRR66 pKa = 11.84ADD68 pKa = 3.11QATNATSGTSASVYY82 pKa = 10.11ISGAFGKK89 pKa = 10.65VSMGDD94 pKa = 3.23VVGASEE100 pKa = 5.28ALFGDD105 pKa = 4.43LAEE108 pKa = 4.58VGYY111 pKa = 9.56TDD113 pKa = 5.8LDD115 pKa = 3.95GAGLGNISGLSVGASRR131 pKa = 11.84NNMGANEE138 pKa = 4.0IPYY141 pKa = 9.04LTGDD145 pKa = 3.12NGGSVVGSTANTGPNLLYY163 pKa = 10.3TGTFGAFSVAASASDD178 pKa = 3.36GKK180 pKa = 10.9AVSTSDD186 pKa = 3.29NQEE189 pKa = 3.72YY190 pKa = 10.9ALAAAYY196 pKa = 9.42TMGDD200 pKa = 3.51YY201 pKa = 10.73TIGAGYY207 pKa = 10.04EE208 pKa = 4.11IVDD211 pKa = 3.72VTTGQNWKK219 pKa = 9.78QGEE222 pKa = 4.39IVGTATFGNTAVKK235 pKa = 10.07AYY237 pKa = 10.07YY238 pKa = 10.73ADD240 pKa = 3.66GSGGNNLDD248 pKa = 3.14KK249 pKa = 10.88AYY251 pKa = 10.2GIGVSSVFGATTVNGYY267 pKa = 9.99VNYY270 pKa = 11.03AEE272 pKa = 4.78ATDD275 pKa = 4.09GTNGTAYY282 pKa = 10.44GIGAAYY288 pKa = 10.27DD289 pKa = 3.73LGGGASVVGGVADD302 pKa = 3.87SDD304 pKa = 3.68IAGTDD309 pKa = 3.35TQADD313 pKa = 3.89LGIKK317 pKa = 10.64FSFF320 pKa = 3.88
Molecular weight: 31.81 kDa
Isoelectric point according different methods:
Protein with the highest isoelectric point:
>tr|A0A085U0Z7|A0A085U0Z7_9RHOB Tryptophan synthase alpha chain OS=Thioclava atlantica OX=1317124 GN=trpA PE=3 SV=1
MM1 pKa = 7.45KK2 pKa = 9.61RR3 pKa = 11.84TFQPSNLVRR12 pKa = 11.84ARR14 pKa = 11.84RR15 pKa = 11.84HH16 pKa = 4.58GFRR19 pKa = 11.84SRR21 pKa = 11.84MATKK25 pKa = 10.5GGRR28 pKa = 11.84KK29 pKa = 8.99VLNARR34 pKa = 11.84RR35 pKa = 11.84AKK37 pKa = 9.69GRR39 pKa = 11.84KK40 pKa = 8.91RR41 pKa = 11.84LSAA44 pKa = 3.96
MM1 pKa = 7.45KK2 pKa = 9.61RR3 pKa = 11.84TFQPSNLVRR12 pKa = 11.84ARR14 pKa = 11.84RR15 pKa = 11.84HH16 pKa = 4.58GFRR19 pKa = 11.84SRR21 pKa = 11.84MATKK25 pKa = 10.5GGRR28 pKa = 11.84KK29 pKa = 8.99VLNARR34 pKa = 11.84RR35 pKa = 11.84AKK37 pKa = 9.69GRR39 pKa = 11.84KK40 pKa = 8.91RR41 pKa = 11.84LSAA44 pKa = 3.96
Molecular weight: 5.11 kDa
Isoelectric point according different methods:
Peptides (in silico digests for buttom-up proteomics)
Below you can find in silico digests of the whole proteome with Trypsin, Chymotrypsin, Trypsin+LysC, LysN, ArgC proteases suitable for different mass spec machines.| Try ESI |
 |
|---|
| ChTry ESI |
 |
|---|
| ArgC ESI |
 |
|---|
| LysN ESI |
 |
|---|
| TryLysC ESI |
 |
|---|
| Try MALDI |
 |
|---|
| ChTry MALDI |
 |
|---|
| ArgC MALDI |
 |
|---|
| LysN MALDI |
 |
|---|
| TryLysC MALDI |
 |
|---|
| Try LTQ |
 |
|---|
| ChTry LTQ |
 |
|---|
| ArgC LTQ |
 |
|---|
| LysN LTQ |
 |
|---|
| TryLysC LTQ |
 |
|---|
| Try MSlow |
 |
|---|
| ChTry MSlow |
 |
|---|
| ArgC MSlow |
 |
|---|
| LysN MSlow |
 |
|---|
| TryLysC MSlow |
 |
|---|
| Try MShigh |
 |
|---|
| ChTry MShigh |
 |
|---|
| ArgC MShigh |
 |
|---|
| LysN MShigh |
 |
|---|
| TryLysC MShigh |
 |
|---|
General Statistics
Number of major isoforms |
Number of additional isoforms |
Number of all proteins |
Number of amino acids |
Min. Seq. Length |
Max. Seq. Length |
Avg. Seq. Length |
Avg. Mol. Weight |
|---|---|---|---|---|---|---|---|
0 |
1170515 |
19 |
5975 |
310.7 |
33.72 |
Amino acid frequency
Ala |
Cys |
Asp |
Glu |
Phe |
Gly |
His |
Ile |
Lys |
Leu |
|---|---|---|---|---|---|---|---|---|---|
12.706 ± 0.059 | 0.809 ± 0.012 |
5.672 ± 0.037 | 6.323 ± 0.045 |
3.645 ± 0.028 | 8.807 ± 0.046 |
2.046 ± 0.019 | 5.182 ± 0.031 |
3.267 ± 0.035 | 10.251 ± 0.052 |
Met |
Asn |
Gln |
Pro |
Arg |
Ser |
Thr |
Val |
Trp |
Tyr |
|---|---|---|---|---|---|---|---|---|---|
2.715 ± 0.02 | 2.377 ± 0.024 |
5.264 ± 0.034 | 3.062 ± 0.023 |
7.097 ± 0.053 | 5.043 ± 0.034 |
5.134 ± 0.037 | 7.076 ± 0.034 |
1.406 ± 0.017 | 2.118 ± 0.018 |
Most of the basic statistics you can see at this page can be downloaded from this CSV file
Proteome-pI is available under Creative Commons Attribution-NoDerivs license, for more details see here
| Reference: Kozlowski LP. Proteome-pI 2.0: Proteome Isoelectric Point Database Update. Nucleic Acids Res. 2021, doi: 10.1093/nar/gkab944 | Contact: Lukasz P. Kozlowski |
