Sclerotinia sclerotiorum deltaflexivirus 1
Taxonomy: Viruses; Riboviria; Orthornavirae; Kitrinoviricota; Alsuviricetes; Tymovirales; Deltaflexiviridae; Deltaflexivirus; Sclerotinia deltaflexivirus 1
Average proteome isoelectric point is 7.54
Get precalculated fractions of proteins

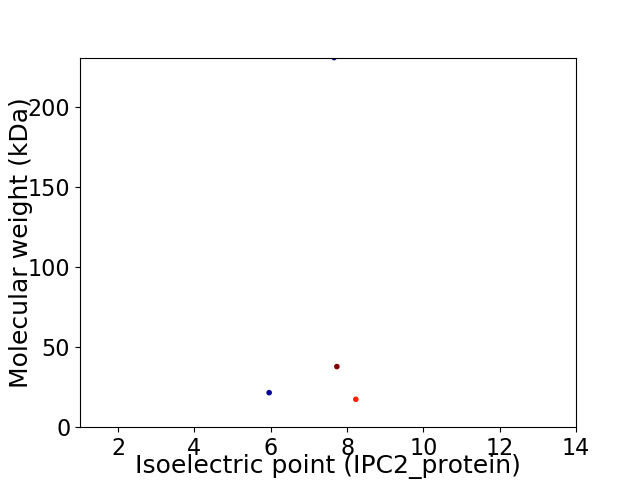
Virtual 2D-PAGE plot for 4 proteins (isoelectric point calculated using IPC2_protein)
Get csv file with sequences according to given criteria:
* You can choose from 21 different methods for calculating isoelectric point
Summary statistics related to proteome-wise predictions


Protein with the lowest isoelectric point:
>tr|A0A125R921|A0A125R921_9VIRU Uncharacterized protein OS=Sclerotinia sclerotiorum deltaflexivirus 1 OX=1788309 PE=4 SV=1
MM1 pKa = 7.42TGSKK5 pKa = 10.15VLIMSALGATDD16 pKa = 3.69TPVSNLTSGVSQIGITSPPTPTDD39 pKa = 2.98IQIPFVQLFNPHH51 pKa = 4.02TKK53 pKa = 10.1YY54 pKa = 10.92RR55 pKa = 11.84LTAADD60 pKa = 3.47ATLRR64 pKa = 11.84AYY66 pKa = 10.58LATYY70 pKa = 10.04EE71 pKa = 4.26SVQFVSLSFAVEE83 pKa = 3.64ITGQNGKK90 pKa = 8.88LQFAATPSDD99 pKa = 3.31ISPSGDD105 pKa = 4.12LDD107 pKa = 3.49WLGAPVYY114 pKa = 10.73QRR116 pKa = 11.84FAGNAQGDD124 pKa = 3.87TFAEE128 pKa = 4.49YY129 pKa = 10.78NFPASHH135 pKa = 7.2PFGHH139 pKa = 6.18EE140 pKa = 3.82LKK142 pKa = 10.83AVALGNAPPRR152 pKa = 11.84FFFQFDD158 pKa = 3.55GSSGDD163 pKa = 3.36VARR166 pKa = 11.84IRR168 pKa = 11.84GRR170 pKa = 11.84LTLRR174 pKa = 11.84GGGRR178 pKa = 11.84GIIPAVSLTEE188 pKa = 3.92LATGKK193 pKa = 9.78NAATIKK199 pKa = 11.0CEE201 pKa = 4.16GEE203 pKa = 3.92NN204 pKa = 3.65
MM1 pKa = 7.42TGSKK5 pKa = 10.15VLIMSALGATDD16 pKa = 3.69TPVSNLTSGVSQIGITSPPTPTDD39 pKa = 2.98IQIPFVQLFNPHH51 pKa = 4.02TKK53 pKa = 10.1YY54 pKa = 10.92RR55 pKa = 11.84LTAADD60 pKa = 3.47ATLRR64 pKa = 11.84AYY66 pKa = 10.58LATYY70 pKa = 10.04EE71 pKa = 4.26SVQFVSLSFAVEE83 pKa = 3.64ITGQNGKK90 pKa = 8.88LQFAATPSDD99 pKa = 3.31ISPSGDD105 pKa = 4.12LDD107 pKa = 3.49WLGAPVYY114 pKa = 10.73QRR116 pKa = 11.84FAGNAQGDD124 pKa = 3.87TFAEE128 pKa = 4.49YY129 pKa = 10.78NFPASHH135 pKa = 7.2PFGHH139 pKa = 6.18EE140 pKa = 3.82LKK142 pKa = 10.83AVALGNAPPRR152 pKa = 11.84FFFQFDD158 pKa = 3.55GSSGDD163 pKa = 3.36VARR166 pKa = 11.84IRR168 pKa = 11.84GRR170 pKa = 11.84LTLRR174 pKa = 11.84GGGRR178 pKa = 11.84GIIPAVSLTEE188 pKa = 3.92LATGKK193 pKa = 9.78NAATIKK199 pKa = 11.0CEE201 pKa = 4.16GEE203 pKa = 3.92NN204 pKa = 3.65
Molecular weight: 21.56 kDa
Isoelectric point according different methods:
Protein with the highest isoelectric point:
>tr|A0A125R922|A0A125R922_9VIRU Uncharacterized protein OS=Sclerotinia sclerotiorum deltaflexivirus 1 OX=1788309 PE=4 SV=1
MM1 pKa = 7.48KK2 pKa = 10.69LFGRR6 pKa = 11.84FNLALMPLALVPLRR20 pKa = 11.84FYY22 pKa = 11.37SRR24 pKa = 11.84TNVTQKK30 pKa = 10.97ILMTTVGPIAMAFAMILMSIVFWGLLFCCFLPNLQFGFILGICHH74 pKa = 6.33YY75 pKa = 9.02MHH77 pKa = 7.01IPCLRR82 pKa = 11.84AIGIWGTLWSFLALQAVVSSSSSAVIFIGQVNLHH116 pKa = 6.89PMTIPQLYY124 pKa = 8.9HH125 pKa = 6.58HH126 pKa = 6.36QLQSCSVAQQWQVSCINLCHH146 pKa = 6.1IHH148 pKa = 6.49SFNPYY153 pKa = 9.6LL154 pKa = 4.15
MM1 pKa = 7.48KK2 pKa = 10.69LFGRR6 pKa = 11.84FNLALMPLALVPLRR20 pKa = 11.84FYY22 pKa = 11.37SRR24 pKa = 11.84TNVTQKK30 pKa = 10.97ILMTTVGPIAMAFAMILMSIVFWGLLFCCFLPNLQFGFILGICHH74 pKa = 6.33YY75 pKa = 9.02MHH77 pKa = 7.01IPCLRR82 pKa = 11.84AIGIWGTLWSFLALQAVVSSSSSAVIFIGQVNLHH116 pKa = 6.89PMTIPQLYY124 pKa = 8.9HH125 pKa = 6.58HH126 pKa = 6.36QLQSCSVAQQWQVSCINLCHH146 pKa = 6.1IHH148 pKa = 6.49SFNPYY153 pKa = 9.6LL154 pKa = 4.15
Molecular weight: 17.42 kDa
Isoelectric point according different methods:
Peptides (in silico digests for buttom-up proteomics)
Below you can find in silico digests of the whole proteome with Trypsin, Chymotrypsin, Trypsin+LysC, LysN, ArgC proteases suitable for different mass spec machines.| Try ESI |
 |
|---|
| ChTry ESI |
 |
|---|
| ArgC ESI |
 |
|---|
| LysN ESI |
 |
|---|
| TryLysC ESI |
 |
|---|
| Try MALDI |
 |
|---|
| ChTry MALDI |
 |
|---|
| ArgC MALDI |
 |
|---|
| LysN MALDI |
 |
|---|
| TryLysC MALDI |
 |
|---|
| Try LTQ |
 |
|---|
| ChTry LTQ |
 |
|---|
| ArgC LTQ |
 |
|---|
| LysN LTQ |
 |
|---|
| TryLysC LTQ |
 |
|---|
| Try MSlow |
 |
|---|
| ChTry MSlow |
 |
|---|
| ArgC MSlow |
 |
|---|
| LysN MSlow |
 |
|---|
| TryLysC MSlow |
 |
|---|
| Try MShigh |
 |
|---|
| ChTry MShigh |
 |
|---|
| ArgC MShigh |
 |
|---|
| LysN MShigh |
 |
|---|
| TryLysC MShigh |
 |
|---|
General Statistics
Number of major isoforms |
Number of additional isoforms |
Number of all proteins |
Number of amino acids |
Min. Seq. Length |
Max. Seq. Length |
Avg. Seq. Length |
Avg. Mol. Weight |
|---|---|---|---|---|---|---|---|
0 |
2772 |
154 |
2075 |
693.0 |
76.87 |
Amino acid frequency
Ala |
Cys |
Asp |
Glu |
Phe |
Gly |
His |
Ile |
Lys |
Leu |
|---|---|---|---|---|---|---|---|---|---|
8.225 ± 0.733 | 1.876 ± 0.436 |
4.365 ± 0.938 | 2.417 ± 0.41 |
5.556 ± 0.823 | 6.746 ± 0.787 |
3.319 ± 0.409 | 5.375 ± 0.632 |
2.85 ± 0.415 | 10.281 ± 1.14 |
Met |
Asn |
Gln |
Pro |
Arg |
Ser |
Thr |
Val |
Trp |
Tyr |
|---|---|---|---|---|---|---|---|---|---|
2.128 ± 0.588 | 3.896 ± 0.253 |
7.612 ± 0.477 | 4.113 ± 0.412 |
4.834 ± 0.508 | 7.648 ± 0.484 |
5.844 ± 0.89 | 7.179 ± 0.474 |
2.309 ± 0.447 | 3.427 ± 0.475 |
Most of the basic statistics you can see at this page can be downloaded from this CSV file
Proteome-pI is available under Creative Commons Attribution-NoDerivs license, for more details see here
| Reference: Kozlowski LP. Proteome-pI 2.0: Proteome Isoelectric Point Database Update. Nucleic Acids Res. 2021, doi: 10.1093/nar/gkab944 | Contact: Lukasz P. Kozlowski |
