Thiohalospira halophila DSM 15071
Taxonomy: cellular organisms; Bacteria; Proteobacteria; Gammaproteobacteria; Chromatiales; Ectothiorhodospiraceae; Thiohalospira; Thiohalospira halophila
Average proteome isoelectric point is 5.78
Get precalculated fractions of proteins
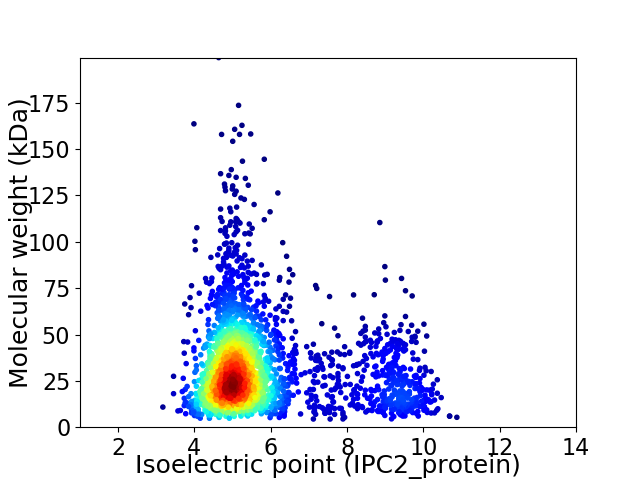
Virtual 2D-PAGE plot for 2641 proteins (isoelectric point calculated using IPC2_protein)
Get csv file with sequences according to given criteria:
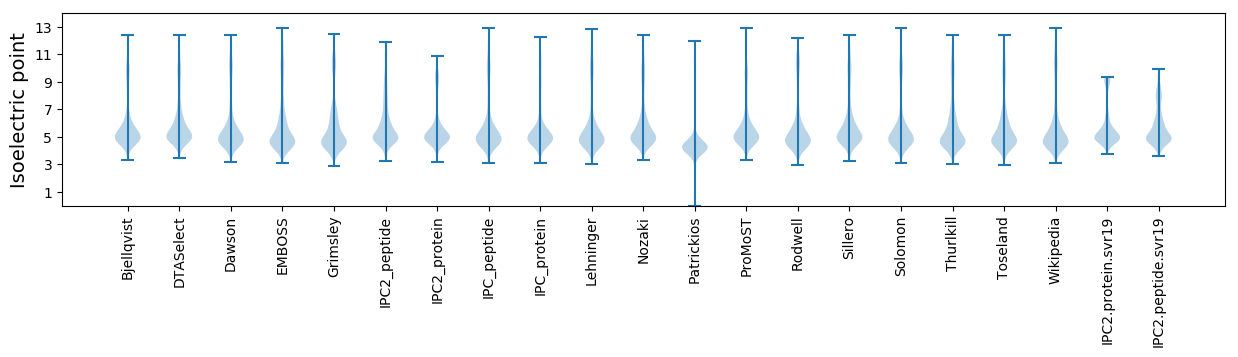
* You can choose from 21 different methods for calculating isoelectric point
Summary statistics related to proteome-wise predictions
Protein with the lowest isoelectric point:
>tr|A0A1I1N820|A0A1I1N820_9GAMM Transposase (Fragment) OS=Thiohalospira halophila DSM 15071 OX=1123397 GN=SAMN05660831_00001 PE=4 SV=1
MM1 pKa = 7.02QRR3 pKa = 11.84TSGFTLIEE11 pKa = 3.99LVIVLVILGVLASVAVPQFSDD32 pKa = 3.15LGEE35 pKa = 4.23EE36 pKa = 4.34AEE38 pKa = 4.49STSVRR43 pKa = 11.84AQANAITSANSVNVANCRR61 pKa = 11.84LSEE64 pKa = 4.13TDD66 pKa = 3.89CVTGLSSCDD75 pKa = 3.36AEE77 pKa = 4.55KK78 pKa = 11.26VNSLMDD84 pKa = 3.94NFDD87 pKa = 3.38TTTWGVADD95 pKa = 5.13GACDD99 pKa = 4.02DD100 pKa = 4.03NSGGTFEE107 pKa = 4.55ITDD110 pKa = 3.79TSGDD114 pKa = 3.73PYY116 pKa = 9.26TTSTCCLTRR125 pKa = 11.84NN126 pKa = 3.65
MM1 pKa = 7.02QRR3 pKa = 11.84TSGFTLIEE11 pKa = 3.99LVIVLVILGVLASVAVPQFSDD32 pKa = 3.15LGEE35 pKa = 4.23EE36 pKa = 4.34AEE38 pKa = 4.49STSVRR43 pKa = 11.84AQANAITSANSVNVANCRR61 pKa = 11.84LSEE64 pKa = 4.13TDD66 pKa = 3.89CVTGLSSCDD75 pKa = 3.36AEE77 pKa = 4.55KK78 pKa = 11.26VNSLMDD84 pKa = 3.94NFDD87 pKa = 3.38TTTWGVADD95 pKa = 5.13GACDD99 pKa = 4.02DD100 pKa = 4.03NSGGTFEE107 pKa = 4.55ITDD110 pKa = 3.79TSGDD114 pKa = 3.73PYY116 pKa = 9.26TTSTCCLTRR125 pKa = 11.84NN126 pKa = 3.65
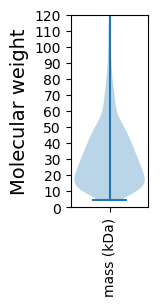
Molecular weight: 13.16 kDa
Isoelectric point according different methods:
Protein with the highest isoelectric point:
>tr|A0A1I1WG97|A0A1I1WG97_9GAMM 1 4-dihydroxy-2-naphthoate octaprenyltransferase OS=Thiohalospira halophila DSM 15071 OX=1123397 GN=SAMN05660831_02641 PE=4 SV=1
MM1 pKa = 7.6RR2 pKa = 11.84LWPRR6 pKa = 11.84STDD9 pKa = 3.1KK10 pKa = 11.16KK11 pKa = 10.61SATLEE16 pKa = 4.46AIFLAPEE23 pKa = 4.2AGAPVVAVAKK33 pKa = 9.36ATVGEE38 pKa = 4.3AGLVGDD44 pKa = 5.3RR45 pKa = 11.84YY46 pKa = 10.46AAQKK50 pKa = 10.3GFWRR54 pKa = 11.84GPDD57 pKa = 3.2ACPITLIRR65 pKa = 11.84AEE67 pKa = 4.85DD68 pKa = 3.58LDD70 pKa = 4.86LIQRR74 pKa = 11.84RR75 pKa = 11.84HH76 pKa = 5.67HH77 pKa = 6.13LAVTAGEE84 pKa = 4.03HH85 pKa = 5.8RR86 pKa = 11.84RR87 pKa = 11.84NLVVRR92 pKa = 11.84GLPSRR97 pKa = 11.84QLTDD101 pKa = 3.34GVLVLGDD108 pKa = 3.19VRR110 pKa = 11.84LRR112 pKa = 11.84LTVPRR117 pKa = 11.84PPCLYY122 pKa = 10.59LEE124 pKa = 4.84RR125 pKa = 11.84LTQRR129 pKa = 11.84GMGRR133 pKa = 11.84ALRR136 pKa = 11.84KK137 pKa = 10.13SGGVCARR144 pKa = 11.84IIQPGSLHH152 pKa = 7.2AGMAIHH158 pKa = 7.1KK159 pKa = 7.74EE160 pKa = 3.91HH161 pKa = 7.03TEE163 pKa = 4.03RR164 pKa = 11.84EE165 pKa = 4.51SPP167 pKa = 3.53
MM1 pKa = 7.6RR2 pKa = 11.84LWPRR6 pKa = 11.84STDD9 pKa = 3.1KK10 pKa = 11.16KK11 pKa = 10.61SATLEE16 pKa = 4.46AIFLAPEE23 pKa = 4.2AGAPVVAVAKK33 pKa = 9.36ATVGEE38 pKa = 4.3AGLVGDD44 pKa = 5.3RR45 pKa = 11.84YY46 pKa = 10.46AAQKK50 pKa = 10.3GFWRR54 pKa = 11.84GPDD57 pKa = 3.2ACPITLIRR65 pKa = 11.84AEE67 pKa = 4.85DD68 pKa = 3.58LDD70 pKa = 4.86LIQRR74 pKa = 11.84RR75 pKa = 11.84HH76 pKa = 5.67HH77 pKa = 6.13LAVTAGEE84 pKa = 4.03HH85 pKa = 5.8RR86 pKa = 11.84RR87 pKa = 11.84NLVVRR92 pKa = 11.84GLPSRR97 pKa = 11.84QLTDD101 pKa = 3.34GVLVLGDD108 pKa = 3.19VRR110 pKa = 11.84LRR112 pKa = 11.84LTVPRR117 pKa = 11.84PPCLYY122 pKa = 10.59LEE124 pKa = 4.84RR125 pKa = 11.84LTQRR129 pKa = 11.84GMGRR133 pKa = 11.84ALRR136 pKa = 11.84KK137 pKa = 10.13SGGVCARR144 pKa = 11.84IIQPGSLHH152 pKa = 7.2AGMAIHH158 pKa = 7.1KK159 pKa = 7.74EE160 pKa = 3.91HH161 pKa = 7.03TEE163 pKa = 4.03RR164 pKa = 11.84EE165 pKa = 4.51SPP167 pKa = 3.53
Molecular weight: 18.26 kDa
Isoelectric point according different methods:
Peptides (in silico digests for buttom-up proteomics)
Below you can find in silico digests of the whole proteome with Trypsin, Chymotrypsin, Trypsin+LysC, LysN, ArgC proteases suitable for different mass spec machines.| Try ESI |
 |
|---|
| ChTry ESI |
|
|---|
| ArgC ESI |
|
|---|
| LysN ESI |
|
|---|
| TryLysC ESI |
|
|---|
| Try MALDI |
|
|---|
| ChTry MALDI |
|
|---|
| ArgC MALDI |
|
|---|
| LysN MALDI |
|
|---|
| TryLysC MALDI |
|
|---|
| Try LTQ |
|
|---|
| ChTry LTQ |
|
|---|
| ArgC LTQ |
|
|---|
| LysN LTQ |
|
|---|
| TryLysC LTQ |
|
|---|
| Try MSlow |
|
|---|
| ChTry MSlow |
|
|---|
| ArgC MSlow |
|
|---|
| LysN MSlow |
|
|---|
| TryLysC MSlow |
|
|---|
| Try MShigh |
|
|---|
| ChTry MShigh |
|
|---|
| ArgC MShigh |
|
|---|
| LysN MShigh |
|
|---|
| TryLysC MShigh |
|
|---|
General Statistics
Number of major isoforms |
Number of additional isoforms |
Number of all proteins |
Number of amino acids |
Min. Seq. Length |
Max. Seq. Length |
Avg. Seq. Length |
Avg. Mol. Weight |
|---|---|---|---|---|---|---|---|
0 |
821077 |
39 |
1778 |
310.9 |
33.93 |
Amino acid frequency
Ala |
Cys |
Asp |
Glu |
Phe |
Gly |
His |
Ile |
Lys |
Leu |
|---|---|---|---|---|---|---|---|---|---|
12.429 ± 0.075 | 0.697 ± 0.017 |
5.981 ± 0.038 | 7.915 ± 0.059 |
3.065 ± 0.034 | 9.067 ± 0.048 |
2.37 ± 0.026 | 3.908 ± 0.036 |
2.007 ± 0.038 | 10.679 ± 0.067 |
Met |
Asn |
Gln |
Pro |
Arg |
Ser |
Thr |
Val |
Trp |
Tyr |
|---|---|---|---|---|---|---|---|---|---|
2.085 ± 0.022 | 2.196 ± 0.026 |
5.378 ± 0.037 | 3.201 ± 0.03 |
8.462 ± 0.057 | 4.391 ± 0.033 |
5.107 ± 0.028 | 7.393 ± 0.039 |
1.457 ± 0.021 | 2.212 ± 0.026 |
Most of the basic statistics you can see at this page can be downloaded from this CSV file
See this proteome in:

Proteome-pI is available under Creative Commons Attribution-NoDerivs license, for more details see here
| Reference: Kozlowski LP. Proteome-pI 2.0: Proteome Isoelectric Point Database Update. Nucleic Acids Res. 2021, doi: 10.1093/nar/gkab944 | Contact: Lukasz P. Kozlowski |