Salinicola sp. MIT1003
Taxonomy: cellular organisms; Bacteria; Proteobacteria; Gammaproteobacteria; Oceanospirillales; Halomonadaceae; Salinicola; unclassified Salinicola
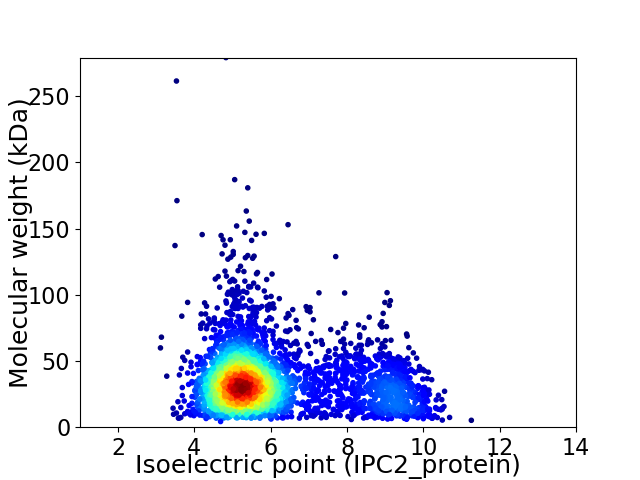
Average proteome isoelectric point is 6.12
Get precalculated fractions of proteins

Virtual 2D-PAGE plot for 3468 proteins (isoelectric point calculated using IPC2_protein)
Get csv file with sequences according to given criteria:
* You can choose from 21 different methods for calculating isoelectric point
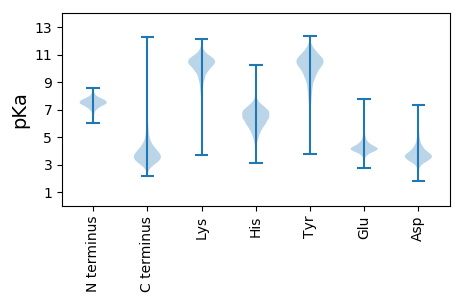
Summary statistics related to proteome-wise predictions


Protein with the lowest isoelectric point:
>tr|A0A1S2DHH7|A0A1S2DHH7_9GAMM Phosphonate metabolism protein PhnP OS=Salinicola sp. MIT1003 OX=1882734 GN=BC443_05575 PE=4 SV=1
MM1 pKa = 7.4KK2 pKa = 10.47KK3 pKa = 8.85STTGLLLGSALVVGLSGCASSGMEE27 pKa = 4.17STGSSSDD34 pKa = 3.52QAWYY38 pKa = 10.29QSPFVCGIAGGLIGGGVGYY57 pKa = 8.28ATSGDD62 pKa = 3.72SDD64 pKa = 4.36EE65 pKa = 4.74DD66 pKa = 3.27TGAAVGGVAGATAGALLCADD86 pKa = 3.97YY87 pKa = 11.17SSDD90 pKa = 4.56VMDD93 pKa = 4.36SDD95 pKa = 4.8GDD97 pKa = 4.09GVPDD101 pKa = 6.13DD102 pKa = 5.8RR103 pKa = 11.84DD104 pKa = 3.43QCPNTPAGVAVDD116 pKa = 4.79AVGCPLDD123 pKa = 3.62TDD125 pKa = 4.11GDD127 pKa = 4.39GVPDD131 pKa = 5.28YY132 pKa = 10.64MDD134 pKa = 3.44QCPGTPAGVEE144 pKa = 4.28VNAQGCPLDD153 pKa = 3.75SDD155 pKa = 4.27GDD157 pKa = 4.25GVPDD161 pKa = 4.49YY162 pKa = 11.09QDD164 pKa = 3.21QCPDD168 pKa = 3.29TPAGAEE174 pKa = 4.21VNSLGCVEE182 pKa = 5.07DD183 pKa = 3.92LVLRR187 pKa = 11.84DD188 pKa = 3.48VNFEE192 pKa = 3.85FDD194 pKa = 4.0SAQLTANAEE203 pKa = 4.32AILDD207 pKa = 4.06GVSEE211 pKa = 4.38KK212 pKa = 11.14LMTNDD217 pKa = 3.02QLRR220 pKa = 11.84IRR222 pKa = 11.84LEE224 pKa = 3.85GHH226 pKa = 5.96TDD228 pKa = 3.22SVGPAAYY235 pKa = 10.02NKK237 pKa = 9.91EE238 pKa = 3.89LSQRR242 pKa = 11.84RR243 pKa = 11.84ADD245 pKa = 3.64SVKK248 pKa = 10.6SYY250 pKa = 10.88LVNKK254 pKa = 9.28GFSADD259 pKa = 3.56NITTIGYY266 pKa = 10.17GEE268 pKa = 4.27EE269 pKa = 4.06QPVASNDD276 pKa = 3.64TAEE279 pKa = 4.3GRR281 pKa = 11.84AQNRR285 pKa = 11.84RR286 pKa = 11.84VEE288 pKa = 4.13LGEE291 pKa = 3.99WEE293 pKa = 4.08
MM1 pKa = 7.4KK2 pKa = 10.47KK3 pKa = 8.85STTGLLLGSALVVGLSGCASSGMEE27 pKa = 4.17STGSSSDD34 pKa = 3.52QAWYY38 pKa = 10.29QSPFVCGIAGGLIGGGVGYY57 pKa = 8.28ATSGDD62 pKa = 3.72SDD64 pKa = 4.36EE65 pKa = 4.74DD66 pKa = 3.27TGAAVGGVAGATAGALLCADD86 pKa = 3.97YY87 pKa = 11.17SSDD90 pKa = 4.56VMDD93 pKa = 4.36SDD95 pKa = 4.8GDD97 pKa = 4.09GVPDD101 pKa = 6.13DD102 pKa = 5.8RR103 pKa = 11.84DD104 pKa = 3.43QCPNTPAGVAVDD116 pKa = 4.79AVGCPLDD123 pKa = 3.62TDD125 pKa = 4.11GDD127 pKa = 4.39GVPDD131 pKa = 5.28YY132 pKa = 10.64MDD134 pKa = 3.44QCPGTPAGVEE144 pKa = 4.28VNAQGCPLDD153 pKa = 3.75SDD155 pKa = 4.27GDD157 pKa = 4.25GVPDD161 pKa = 4.49YY162 pKa = 11.09QDD164 pKa = 3.21QCPDD168 pKa = 3.29TPAGAEE174 pKa = 4.21VNSLGCVEE182 pKa = 5.07DD183 pKa = 3.92LVLRR187 pKa = 11.84DD188 pKa = 3.48VNFEE192 pKa = 3.85FDD194 pKa = 4.0SAQLTANAEE203 pKa = 4.32AILDD207 pKa = 4.06GVSEE211 pKa = 4.38KK212 pKa = 11.14LMTNDD217 pKa = 3.02QLRR220 pKa = 11.84IRR222 pKa = 11.84LEE224 pKa = 3.85GHH226 pKa = 5.96TDD228 pKa = 3.22SVGPAAYY235 pKa = 10.02NKK237 pKa = 9.91EE238 pKa = 3.89LSQRR242 pKa = 11.84RR243 pKa = 11.84ADD245 pKa = 3.64SVKK248 pKa = 10.6SYY250 pKa = 10.88LVNKK254 pKa = 9.28GFSADD259 pKa = 3.56NITTIGYY266 pKa = 10.17GEE268 pKa = 4.27EE269 pKa = 4.06QPVASNDD276 pKa = 3.64TAEE279 pKa = 4.3GRR281 pKa = 11.84AQNRR285 pKa = 11.84RR286 pKa = 11.84VEE288 pKa = 4.13LGEE291 pKa = 3.99WEE293 pKa = 4.08
Molecular weight: 29.94 kDa
Isoelectric point according different methods:
Protein with the highest isoelectric point:
>tr|A0A1S2DCE5|A0A1S2DCE5_9GAMM GntR family transcriptional regulator OS=Salinicola sp. MIT1003 OX=1882734 GN=BC443_03945 PE=4 SV=1
MM1 pKa = 7.45KK2 pKa = 9.51RR3 pKa = 11.84TFQPSVLKK11 pKa = 10.34RR12 pKa = 11.84KK13 pKa = 9.1RR14 pKa = 11.84VHH16 pKa = 6.26GFRR19 pKa = 11.84ARR21 pKa = 11.84MATKK25 pKa = 10.42NGRR28 pKa = 11.84QVIARR33 pKa = 11.84RR34 pKa = 11.84RR35 pKa = 11.84AKK37 pKa = 9.91GRR39 pKa = 11.84KK40 pKa = 8.85RR41 pKa = 11.84LSAA44 pKa = 3.96
MM1 pKa = 7.45KK2 pKa = 9.51RR3 pKa = 11.84TFQPSVLKK11 pKa = 10.34RR12 pKa = 11.84KK13 pKa = 9.1RR14 pKa = 11.84VHH16 pKa = 6.26GFRR19 pKa = 11.84ARR21 pKa = 11.84MATKK25 pKa = 10.42NGRR28 pKa = 11.84QVIARR33 pKa = 11.84RR34 pKa = 11.84RR35 pKa = 11.84AKK37 pKa = 9.91GRR39 pKa = 11.84KK40 pKa = 8.85RR41 pKa = 11.84LSAA44 pKa = 3.96
Molecular weight: 5.21 kDa
Isoelectric point according different methods:
Peptides (in silico digests for buttom-up proteomics)
Below you can find in silico digests of the whole proteome with Trypsin, Chymotrypsin, Trypsin+LysC, LysN, ArgC proteases suitable for different mass spec machines.| Try ESI |
 |
|---|
| ChTry ESI |
 |
|---|
| ArgC ESI |
 |
|---|
| LysN ESI |
 |
|---|
| TryLysC ESI |
 |
|---|
| Try MALDI |
 |
|---|
| ChTry MALDI |
 |
|---|
| ArgC MALDI |
 |
|---|
| LysN MALDI |
 |
|---|
| TryLysC MALDI |
 |
|---|
| Try LTQ |
 |
|---|
| ChTry LTQ |
 |
|---|
| ArgC LTQ |
 |
|---|
| LysN LTQ |
 |
|---|
| TryLysC LTQ |
 |
|---|
| Try MSlow |
 |
|---|
| ChTry MSlow |
 |
|---|
| ArgC MSlow |
 |
|---|
| LysN MSlow |
 |
|---|
| TryLysC MSlow |
 |
|---|
| Try MShigh |
 |
|---|
| ChTry MShigh |
 |
|---|
| ArgC MShigh |
 |
|---|
| LysN MShigh |
 |
|---|
| TryLysC MShigh |
 |
|---|
General Statistics
Number of major isoforms |
Number of additional isoforms |
Number of all proteins |
Number of amino acids |
Min. Seq. Length |
Max. Seq. Length |
Avg. Seq. Length |
Avg. Mol. Weight |
|---|---|---|---|---|---|---|---|
0 |
1139571 |
43 |
2602 |
328.6 |
36.1 |
Amino acid frequency
Ala |
Cys |
Asp |
Glu |
Phe |
Gly |
His |
Ile |
Lys |
Leu |
|---|---|---|---|---|---|---|---|---|---|
10.971 ± 0.047 | 0.915 ± 0.012 |
6.058 ± 0.04 | 6.179 ± 0.042 |
3.509 ± 0.024 | 8.146 ± 0.039 |
2.399 ± 0.024 | 4.986 ± 0.034 |
2.771 ± 0.035 | 11.034 ± 0.064 |
Met |
Asn |
Gln |
Pro |
Arg |
Ser |
Thr |
Val |
Trp |
Tyr |
|---|---|---|---|---|---|---|---|---|---|
2.469 ± 0.019 | 2.658 ± 0.025 |
4.876 ± 0.025 | 3.975 ± 0.033 |
7.25 ± 0.044 | 5.733 ± 0.031 |
5.057 ± 0.03 | 7.065 ± 0.033 |
1.513 ± 0.019 | 2.436 ± 0.02 |
Most of the basic statistics you can see at this page can be downloaded from this CSV file
Proteome-pI is available under Creative Commons Attribution-NoDerivs license, for more details see here
| Reference: Kozlowski LP. Proteome-pI 2.0: Proteome Isoelectric Point Database Update. Nucleic Acids Res. 2021, doi: 10.1093/nar/gkab944 | Contact: Lukasz P. Kozlowski |
