Saccharothrix sp. ALI-22-I
Taxonomy: cellular organisms; Bacteria; Terrabacteria group; Actinobacteria; Actinomycetia; Pseudonocardiales; Pseudonocardiaceae; Saccharothrix; unclassified Saccharothrix
Average proteome isoelectric point is 6.27
Get precalculated fractions of proteins

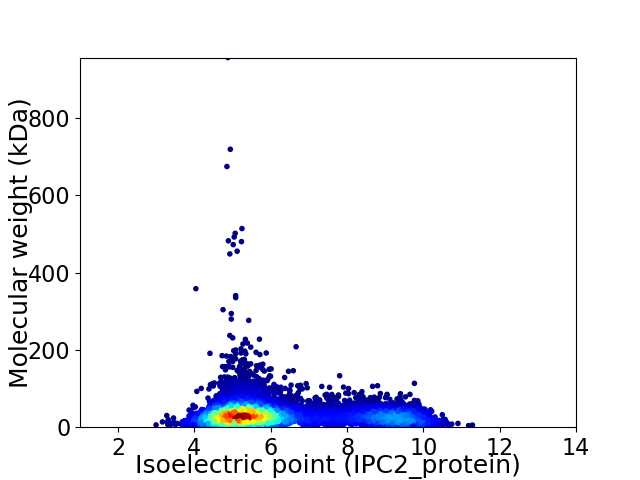
Virtual 2D-PAGE plot for 8733 proteins (isoelectric point calculated using IPC2_protein)
Get csv file with sequences according to given criteria:
* You can choose from 21 different methods for calculating isoelectric point
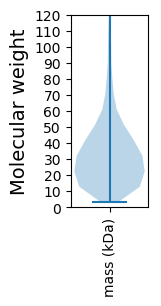
Summary statistics related to proteome-wise predictions


Protein with the lowest isoelectric point:
>tr|A0A1V2Q5Y3|A0A1V2Q5Y3_9PSEU Cupin OS=Saccharothrix sp. ALI-22-I OX=1933778 GN=ALI22I_34615 PE=4 SV=1
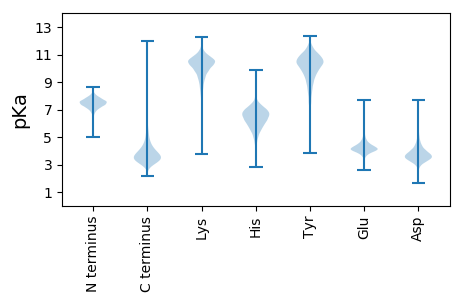
MM1 pKa = 7.09SAEE4 pKa = 3.34IRR6 pKa = 11.84IYY8 pKa = 10.27HH9 pKa = 7.09AYY11 pKa = 10.65SPDD14 pKa = 3.04QYY16 pKa = 11.39AQVVEE21 pKa = 4.07LWEE24 pKa = 4.43RR25 pKa = 11.84LLSCHH30 pKa = 6.47RR31 pKa = 11.84VGLSEE36 pKa = 4.12DD37 pKa = 3.55RR38 pKa = 11.84YY39 pKa = 11.31GRR41 pKa = 11.84GLDD44 pKa = 3.46KK45 pKa = 10.84IEE47 pKa = 4.71PEE49 pKa = 3.65WLYY52 pKa = 11.05QLVMSDD58 pKa = 3.18GAEE61 pKa = 4.21TYY63 pKa = 9.96DD64 pKa = 3.79YY65 pKa = 10.64PAVTVTVAEE74 pKa = 4.11YY75 pKa = 10.93SDD77 pKa = 4.26YY78 pKa = 11.74NGDD81 pKa = 3.7EE82 pKa = 3.88YY83 pKa = 11.55DD84 pKa = 3.59AANVAVLEE92 pKa = 4.25DD93 pKa = 3.69QYY95 pKa = 12.19GLNTRR100 pKa = 11.84GGSHH104 pKa = 6.33GWQAAWVQLGEE115 pKa = 4.56LPVITDD121 pKa = 3.31DD122 pKa = 4.42TIDD125 pKa = 3.43VGIEE129 pKa = 3.75RR130 pKa = 11.84LKK132 pKa = 10.07TLVEE136 pKa = 4.15VVEE139 pKa = 5.23ALTQGDD145 pKa = 4.97VVCLDD150 pKa = 4.03DD151 pKa = 6.78DD152 pKa = 3.77VLEE155 pKa = 4.38DD156 pKa = 3.43HH157 pKa = 6.55RR158 pKa = 11.84QAVIEE163 pKa = 4.27DD164 pKa = 3.47TWVNYY169 pKa = 7.28YY170 pKa = 10.74ARR172 pKa = 11.84EE173 pKa = 3.9LSSALEE179 pKa = 4.44DD180 pKa = 3.48LTDD183 pKa = 3.79YY184 pKa = 11.52NSDD187 pKa = 3.73DD188 pKa = 4.33LGFSDD193 pKa = 5.85EE194 pKa = 4.9EE195 pKa = 4.06IKK197 pKa = 10.92SLYY200 pKa = 10.62FEE202 pKa = 5.4FEE204 pKa = 4.02GNDD207 pKa = 3.26WEE209 pKa = 4.47FQGATEE215 pKa = 4.08ITNNGHH221 pKa = 6.77DD222 pKa = 3.69EE223 pKa = 4.19AVEE226 pKa = 3.96HH227 pKa = 6.22VIEE230 pKa = 4.83TIRR233 pKa = 11.84DD234 pKa = 3.21AWRR237 pKa = 11.84APYY240 pKa = 10.31VDD242 pKa = 4.57PDD244 pKa = 3.74QFALPLASS252 pKa = 3.68
MM1 pKa = 7.09SAEE4 pKa = 3.34IRR6 pKa = 11.84IYY8 pKa = 10.27HH9 pKa = 7.09AYY11 pKa = 10.65SPDD14 pKa = 3.04QYY16 pKa = 11.39AQVVEE21 pKa = 4.07LWEE24 pKa = 4.43RR25 pKa = 11.84LLSCHH30 pKa = 6.47RR31 pKa = 11.84VGLSEE36 pKa = 4.12DD37 pKa = 3.55RR38 pKa = 11.84YY39 pKa = 11.31GRR41 pKa = 11.84GLDD44 pKa = 3.46KK45 pKa = 10.84IEE47 pKa = 4.71PEE49 pKa = 3.65WLYY52 pKa = 11.05QLVMSDD58 pKa = 3.18GAEE61 pKa = 4.21TYY63 pKa = 9.96DD64 pKa = 3.79YY65 pKa = 10.64PAVTVTVAEE74 pKa = 4.11YY75 pKa = 10.93SDD77 pKa = 4.26YY78 pKa = 11.74NGDD81 pKa = 3.7EE82 pKa = 3.88YY83 pKa = 11.55DD84 pKa = 3.59AANVAVLEE92 pKa = 4.25DD93 pKa = 3.69QYY95 pKa = 12.19GLNTRR100 pKa = 11.84GGSHH104 pKa = 6.33GWQAAWVQLGEE115 pKa = 4.56LPVITDD121 pKa = 3.31DD122 pKa = 4.42TIDD125 pKa = 3.43VGIEE129 pKa = 3.75RR130 pKa = 11.84LKK132 pKa = 10.07TLVEE136 pKa = 4.15VVEE139 pKa = 5.23ALTQGDD145 pKa = 4.97VVCLDD150 pKa = 4.03DD151 pKa = 6.78DD152 pKa = 3.77VLEE155 pKa = 4.38DD156 pKa = 3.43HH157 pKa = 6.55RR158 pKa = 11.84QAVIEE163 pKa = 4.27DD164 pKa = 3.47TWVNYY169 pKa = 7.28YY170 pKa = 10.74ARR172 pKa = 11.84EE173 pKa = 3.9LSSALEE179 pKa = 4.44DD180 pKa = 3.48LTDD183 pKa = 3.79YY184 pKa = 11.52NSDD187 pKa = 3.73DD188 pKa = 4.33LGFSDD193 pKa = 5.85EE194 pKa = 4.9EE195 pKa = 4.06IKK197 pKa = 10.92SLYY200 pKa = 10.62FEE202 pKa = 5.4FEE204 pKa = 4.02GNDD207 pKa = 3.26WEE209 pKa = 4.47FQGATEE215 pKa = 4.08ITNNGHH221 pKa = 6.77DD222 pKa = 3.69EE223 pKa = 4.19AVEE226 pKa = 3.96HH227 pKa = 6.22VIEE230 pKa = 4.83TIRR233 pKa = 11.84DD234 pKa = 3.21AWRR237 pKa = 11.84APYY240 pKa = 10.31VDD242 pKa = 4.57PDD244 pKa = 3.74QFALPLASS252 pKa = 3.68
Molecular weight: 28.62 kDa
Isoelectric point according different methods:
Protein with the highest isoelectric point:
>tr|A0A1V2Q1X3|A0A1V2Q1X3_9PSEU Uncharacterized protein OS=Saccharothrix sp. ALI-22-I OX=1933778 GN=ALI22I_39225 PE=4 SV=1
MM1 pKa = 7.53SKK3 pKa = 10.53GKK5 pKa = 8.66RR6 pKa = 11.84TFQPNNRR13 pKa = 11.84RR14 pKa = 11.84RR15 pKa = 11.84AKK17 pKa = 8.7THH19 pKa = 5.15GFRR22 pKa = 11.84LRR24 pKa = 11.84MRR26 pKa = 11.84TRR28 pKa = 11.84AGRR31 pKa = 11.84AILAARR37 pKa = 11.84RR38 pKa = 11.84GKK40 pKa = 10.38GRR42 pKa = 11.84QQLSAA47 pKa = 4.05
MM1 pKa = 7.53SKK3 pKa = 10.53GKK5 pKa = 8.66RR6 pKa = 11.84TFQPNNRR13 pKa = 11.84RR14 pKa = 11.84RR15 pKa = 11.84AKK17 pKa = 8.7THH19 pKa = 5.15GFRR22 pKa = 11.84LRR24 pKa = 11.84MRR26 pKa = 11.84TRR28 pKa = 11.84AGRR31 pKa = 11.84AILAARR37 pKa = 11.84RR38 pKa = 11.84GKK40 pKa = 10.38GRR42 pKa = 11.84QQLSAA47 pKa = 4.05
Molecular weight: 5.45 kDa
Isoelectric point according different methods:
Peptides (in silico digests for buttom-up proteomics)
Below you can find in silico digests of the whole proteome with Trypsin, Chymotrypsin, Trypsin+LysC, LysN, ArgC proteases suitable for different mass spec machines.| Try ESI |
 |
|---|
| ChTry ESI |
 |
|---|
| ArgC ESI |
 |
|---|
| LysN ESI |
 |
|---|
| TryLysC ESI |
 |
|---|
| Try MALDI |
 |
|---|
| ChTry MALDI |
 |
|---|
| ArgC MALDI |
 |
|---|
| LysN MALDI |
 |
|---|
| TryLysC MALDI |
 |
|---|
| Try LTQ |
 |
|---|
| ChTry LTQ |
 |
|---|
| ArgC LTQ |
 |
|---|
| LysN LTQ |
 |
|---|
| TryLysC LTQ |
 |
|---|
| Try MSlow |
 |
|---|
| ChTry MSlow |
 |
|---|
| ArgC MSlow |
 |
|---|
| LysN MSlow |
 |
|---|
| TryLysC MSlow |
 |
|---|
| Try MShigh |
 |
|---|
| ChTry MShigh |
 |
|---|
| ArgC MShigh |
 |
|---|
| LysN MShigh |
 |
|---|
| TryLysC MShigh |
 |
|---|
General Statistics
Number of major isoforms |
Number of additional isoforms |
Number of all proteins |
Number of amino acids |
Min. Seq. Length |
Max. Seq. Length |
Avg. Seq. Length |
Avg. Mol. Weight |
|---|---|---|---|---|---|---|---|
0 |
2886714 |
31 |
8808 |
330.6 |
35.54 |
Amino acid frequency
Ala |
Cys |
Asp |
Glu |
Phe |
Gly |
His |
Ile |
Lys |
Leu |
|---|---|---|---|---|---|---|---|---|---|
12.852 ± 0.038 | 0.754 ± 0.007 |
6.293 ± 0.027 | 5.445 ± 0.022 |
2.898 ± 0.016 | 9.041 ± 0.026 |
2.351 ± 0.014 | 3.192 ± 0.02 |
1.974 ± 0.019 | 10.395 ± 0.037 |
Met |
Asn |
Gln |
Pro |
Arg |
Ser |
Thr |
Val |
Trp |
Tyr |
|---|---|---|---|---|---|---|---|---|---|
1.664 ± 0.011 | 2.029 ± 0.02 |
5.88 ± 0.024 | 2.786 ± 0.016 |
8.0 ± 0.031 | 5.107 ± 0.02 |
6.233 ± 0.029 | 9.475 ± 0.031 |
1.62 ± 0.011 | 2.009 ± 0.015 |
Most of the basic statistics you can see at this page can be downloaded from this CSV file
Proteome-pI is available under Creative Commons Attribution-NoDerivs license, for more details see here
| Reference: Kozlowski LP. Proteome-pI 2.0: Proteome Isoelectric Point Database Update. Nucleic Acids Res. 2021, doi: 10.1093/nar/gkab944 | Contact: Lukasz P. Kozlowski |
