Tomato apical leaf curl virus
Taxonomy: Viruses; Monodnaviria; Shotokuvirae; Cressdnaviricota; Repensiviricetes; Geplafuvirales; Geminiviridae; Topilevirus
Average proteome isoelectric point is 8.04
Get precalculated fractions of proteins

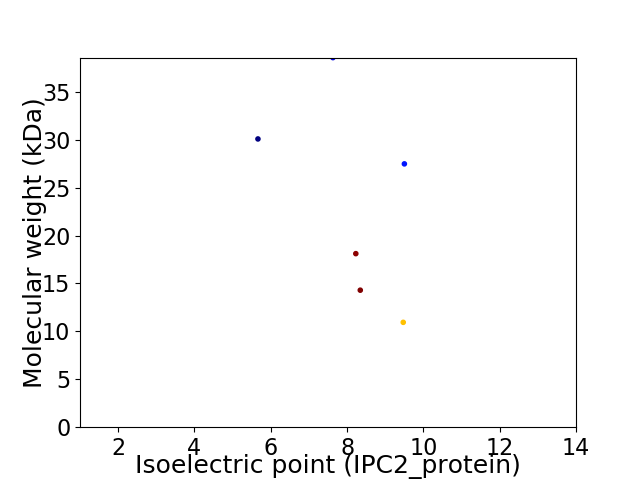
Virtual 2D-PAGE plot for 6 proteins (isoelectric point calculated using IPC2_protein)
Get csv file with sequences according to given criteria:
* You can choose from 21 different methods for calculating isoelectric point
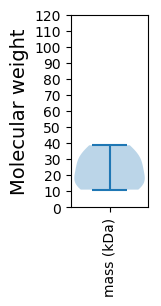
Summary statistics related to proteome-wise predictions


Protein with the lowest isoelectric point:
>tr|A0A2H4Z9M5|A0A2H4Z9M5_9GEMI C3 OS=Tomato apical leaf curl virus OX=2060142 GN=C3 PE=4 SV=1
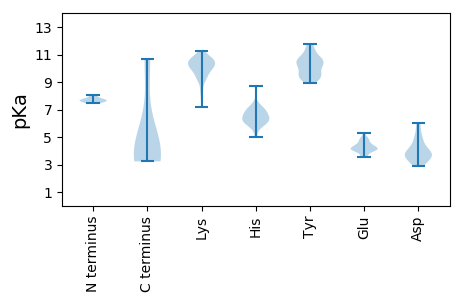
MM1 pKa = 7.71PRR3 pKa = 11.84TPNTFRR9 pKa = 11.84LQGKK13 pKa = 9.52SIFLTYY19 pKa = 9.14PKK21 pKa = 10.35CPLIPLFVIDD31 pKa = 6.0YY32 pKa = 9.56LFQLLNDD39 pKa = 4.15FKK41 pKa = 10.17ITYY44 pKa = 10.32ARR46 pKa = 11.84VCQEE50 pKa = 3.52THH52 pKa = 6.17QDD54 pKa = 3.71GEE56 pKa = 4.45LHH58 pKa = 6.09LHH60 pKa = 6.45CLVQLEE66 pKa = 4.86EE67 pKa = 4.49KK68 pKa = 10.63FSTRR72 pKa = 11.84NPRR75 pKa = 11.84FFDD78 pKa = 2.99ISDD81 pKa = 3.84PNRR84 pKa = 11.84EE85 pKa = 4.17STYY88 pKa = 10.62HH89 pKa = 6.79PNAQIPRR96 pKa = 11.84RR97 pKa = 11.84DD98 pKa = 3.62ADD100 pKa = 3.59VADD103 pKa = 4.82YY104 pKa = 10.23IAKK107 pKa = 9.99GGVYY111 pKa = 9.12EE112 pKa = 4.12EE113 pKa = 4.74RR114 pKa = 11.84GLLRR118 pKa = 11.84ASRR121 pKa = 11.84RR122 pKa = 11.84SPKK125 pKa = 9.96KK126 pKa = 10.4SRR128 pKa = 11.84DD129 pKa = 3.96TIWGKK134 pKa = 10.48IIEE137 pKa = 4.48EE138 pKa = 4.26STNAEE143 pKa = 4.26DD144 pKa = 5.04FLSRR148 pKa = 11.84CQRR151 pKa = 11.84EE152 pKa = 4.04QPYY155 pKa = 9.48TYY157 pKa = 10.01ATQLRR162 pKa = 11.84NLEE165 pKa = 3.91YY166 pKa = 9.73MANKK170 pKa = 9.58KK171 pKa = 8.28WPKK174 pKa = 9.26PSANFTPKK182 pKa = 10.11FSIFNGVPEE191 pKa = 4.99PIKK194 pKa = 10.91NWVEE198 pKa = 3.62QNICVVHH205 pKa = 7.04RR206 pKa = 11.84DD207 pKa = 4.56FILLDD212 pKa = 3.81VPQLTQNDD220 pKa = 3.91LDD222 pKa = 5.19FYY224 pKa = 11.51DD225 pKa = 5.42SMAQEE230 pKa = 4.69SIEE233 pKa = 4.11QILEE237 pKa = 4.05NPDD240 pKa = 2.95NFTNIRR246 pKa = 11.84PHH248 pKa = 7.21IYY250 pKa = 9.87NDD252 pKa = 3.63SGPGEE257 pKa = 4.1
MM1 pKa = 7.71PRR3 pKa = 11.84TPNTFRR9 pKa = 11.84LQGKK13 pKa = 9.52SIFLTYY19 pKa = 9.14PKK21 pKa = 10.35CPLIPLFVIDD31 pKa = 6.0YY32 pKa = 9.56LFQLLNDD39 pKa = 4.15FKK41 pKa = 10.17ITYY44 pKa = 10.32ARR46 pKa = 11.84VCQEE50 pKa = 3.52THH52 pKa = 6.17QDD54 pKa = 3.71GEE56 pKa = 4.45LHH58 pKa = 6.09LHH60 pKa = 6.45CLVQLEE66 pKa = 4.86EE67 pKa = 4.49KK68 pKa = 10.63FSTRR72 pKa = 11.84NPRR75 pKa = 11.84FFDD78 pKa = 2.99ISDD81 pKa = 3.84PNRR84 pKa = 11.84EE85 pKa = 4.17STYY88 pKa = 10.62HH89 pKa = 6.79PNAQIPRR96 pKa = 11.84RR97 pKa = 11.84DD98 pKa = 3.62ADD100 pKa = 3.59VADD103 pKa = 4.82YY104 pKa = 10.23IAKK107 pKa = 9.99GGVYY111 pKa = 9.12EE112 pKa = 4.12EE113 pKa = 4.74RR114 pKa = 11.84GLLRR118 pKa = 11.84ASRR121 pKa = 11.84RR122 pKa = 11.84SPKK125 pKa = 9.96KK126 pKa = 10.4SRR128 pKa = 11.84DD129 pKa = 3.96TIWGKK134 pKa = 10.48IIEE137 pKa = 4.48EE138 pKa = 4.26STNAEE143 pKa = 4.26DD144 pKa = 5.04FLSRR148 pKa = 11.84CQRR151 pKa = 11.84EE152 pKa = 4.04QPYY155 pKa = 9.48TYY157 pKa = 10.01ATQLRR162 pKa = 11.84NLEE165 pKa = 3.91YY166 pKa = 9.73MANKK170 pKa = 9.58KK171 pKa = 8.28WPKK174 pKa = 9.26PSANFTPKK182 pKa = 10.11FSIFNGVPEE191 pKa = 4.99PIKK194 pKa = 10.91NWVEE198 pKa = 3.62QNICVVHH205 pKa = 7.04RR206 pKa = 11.84DD207 pKa = 4.56FILLDD212 pKa = 3.81VPQLTQNDD220 pKa = 3.91LDD222 pKa = 5.19FYY224 pKa = 11.51DD225 pKa = 5.42SMAQEE230 pKa = 4.69SIEE233 pKa = 4.11QILEE237 pKa = 4.05NPDD240 pKa = 2.95NFTNIRR246 pKa = 11.84PHH248 pKa = 7.21IYY250 pKa = 9.87NDD252 pKa = 3.63SGPGEE257 pKa = 4.1
Molecular weight: 30.08 kDa
Isoelectric point according different methods:
Protein with the highest isoelectric point:
>tr|A0A2H4Z9X4|A0A2H4Z9X4_9GEMI Putative ssDNA-dsDNA regulatory protein OS=Tomato apical leaf curl virus OX=2060142 GN=V3 PE=4 SV=1
MM1 pKa = 8.08DD2 pKa = 3.32WTFNAWVYY10 pKa = 10.63LFVFISTVIITVFNGVTSIQLLRR33 pKa = 11.84ISEE36 pKa = 4.1KK37 pKa = 10.38LQRR40 pKa = 11.84ISADD44 pKa = 3.14LRR46 pKa = 11.84GSISHH51 pKa = 6.93LAITIGVAEE60 pKa = 4.41GRR62 pKa = 11.84VFQPSQGGRR71 pKa = 11.84VLRR74 pKa = 11.84VGRR77 pKa = 11.84TVSVPNRR84 pKa = 11.84VQEE87 pKa = 4.0DD88 pKa = 4.42RR89 pKa = 11.84PTGGEE94 pKa = 4.21TQVSPP99 pKa = 4.41
MM1 pKa = 8.08DD2 pKa = 3.32WTFNAWVYY10 pKa = 10.63LFVFISTVIITVFNGVTSIQLLRR33 pKa = 11.84ISEE36 pKa = 4.1KK37 pKa = 10.38LQRR40 pKa = 11.84ISADD44 pKa = 3.14LRR46 pKa = 11.84GSISHH51 pKa = 6.93LAITIGVAEE60 pKa = 4.41GRR62 pKa = 11.84VFQPSQGGRR71 pKa = 11.84VLRR74 pKa = 11.84VGRR77 pKa = 11.84TVSVPNRR84 pKa = 11.84VQEE87 pKa = 4.0DD88 pKa = 4.42RR89 pKa = 11.84PTGGEE94 pKa = 4.21TQVSPP99 pKa = 4.41
Molecular weight: 10.94 kDa
Isoelectric point according different methods:
Peptides (in silico digests for buttom-up proteomics)
Below you can find in silico digests of the whole proteome with Trypsin, Chymotrypsin, Trypsin+LysC, LysN, ArgC proteases suitable for different mass spec machines.| Try ESI |
 |
|---|
| ChTry ESI |
 |
|---|
| ArgC ESI |
 |
|---|
| LysN ESI |
 |
|---|
| TryLysC ESI |
 |
|---|
| Try MALDI |
 |
|---|
| ChTry MALDI |
 |
|---|
| ArgC MALDI |
 |
|---|
| LysN MALDI |
 |
|---|
| TryLysC MALDI |
 |
|---|
| Try LTQ |
 |
|---|
| ChTry LTQ |
 |
|---|
| ArgC LTQ |
 |
|---|
| LysN LTQ |
 |
|---|
| TryLysC LTQ |
 |
|---|
| Try MSlow |
 |
|---|
| ChTry MSlow |
 |
|---|
| ArgC MSlow |
 |
|---|
| LysN MSlow |
 |
|---|
| TryLysC MSlow |
 |
|---|
| Try MShigh |
 |
|---|
| ChTry MShigh |
 |
|---|
| ArgC MShigh |
 |
|---|
| LysN MShigh |
 |
|---|
| TryLysC MShigh |
 |
|---|
General Statistics
Number of major isoforms |
Number of additional isoforms |
Number of all proteins |
Number of amino acids |
Min. Seq. Length |
Max. Seq. Length |
Avg. Seq. Length |
Avg. Mol. Weight |
|---|---|---|---|---|---|---|---|
0 |
1211 |
99 |
332 |
201.8 |
23.25 |
Amino acid frequency
Ala |
Cys |
Asp |
Glu |
Phe |
Gly |
His |
Ile |
Lys |
Leu |
|---|---|---|---|---|---|---|---|---|---|
4.872 ± 0.653 | 1.899 ± 0.361 |
4.789 ± 0.573 | 5.78 ± 1.14 |
4.872 ± 0.66 | 5.533 ± 1.018 |
1.982 ± 0.28 | 6.441 ± 0.482 |
6.193 ± 0.918 | 7.845 ± 0.445 |
Met |
Asn |
Gln |
Pro |
Arg |
Ser |
Thr |
Val |
Trp |
Tyr |
|---|---|---|---|---|---|---|---|---|---|
1.239 ± 0.316 | 5.78 ± 0.472 |
5.615 ± 0.881 | 4.542 ± 0.713 |
6.936 ± 0.284 | 7.597 ± 0.932 |
6.524 ± 0.797 | 5.12 ± 0.979 |
1.817 ± 0.239 | 4.624 ± 0.546 |
Most of the basic statistics you can see at this page can be downloaded from this CSV file
Proteome-pI is available under Creative Commons Attribution-NoDerivs license, for more details see here
| Reference: Kozlowski LP. Proteome-pI 2.0: Proteome Isoelectric Point Database Update. Nucleic Acids Res. 2021, doi: 10.1093/nar/gkab944 | Contact: Lukasz P. Kozlowski |
